Seagate 2011 Annual Report Download - page 53
Download and view the complete annual report
Please find page 53 of the 2011 Seagate annual report below. You can navigate through the pages in the report by either clicking on the pages listed below, or by using the keyword search tool below to find specific information within the annual report.-
 1
1 -
2
-
3
-
4
-
5
-
6
-
7
-
8
-
9
-
10
-
11
-
12
-
13
-
14
-
15
-
16
-
17
-
18
-
19
-
20
-
21
-
22
-
23
-
24
-
25
-
26
-
27
-
28
-
29
-
30
-
31
-
32
-
33
-
34
-
35
-
36
-
37
-
38
-
39
-
40
-
41
-
42
-
 43
43 -
 44
44 -
 45
45 -
 46
46 -
 47
47 -
 48
48 -
 49
49 -
 50
50 -
 51
51 -
 52
52 -
 53
53 -
 54
54 -
 55
55 -
 56
56 -
 57
57 -
 58
58 -
 59
59 -
 60
60 -
 61
61 -
 62
62 -
 63
63 -
64
-
65
-
66
-
67
-
68
-
69
-
70
-
71
-
72
-
73
-
74
-
75
-
76
-
77
-
78
-
79
-
80
-
81
-
82
-
83
-
84
-
85
-
86
-
87
-
88
-
89
-
90
-
91
-
92
-
93
-
94
-
95
-
96
-
97
-
98
-
99
-
100
-
101
-
102
-
103
-
104
-
105
-
106
-
107
-
108
-
109
-
110
-
111
-
112
-
113
-
114
-
115
-
116
-
117
-
118
-
119
-
120
-
121
-
122
-
123
-
124
-
125
-
126
-
127
-
128
-
129
-
130
-
131
-
132
-
133
-
134
-
135
-
136
-
137
-
138
-
139
-
140
-
141
-
142
-
143
-
144
-
145
-
146
-
147
-
148
-
149
-
150
-
151
-
152
-
153
-
154
-
155
-
156
-
157
-
158
-
159
-
160
-
161
-
162
-
163
-
164
-
165
-
166
-
167
-
168
-
169
-
170
-
171
-
172
-
173
-
174
-
175
-
176
-
177
-
178
-
179
-
180
-
181
-
182
-
183
-
184
-
185
-
186
-
187
-
188
-
189
 |
 |

Table of Contents
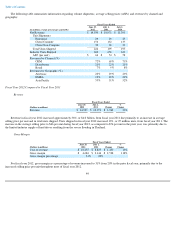
The following table summarizes information regarding volume shipments, average selling prices (ASPs) and revenues by channel and
geography:
Fiscal Year 2012 Compared to Fiscal Year 2011
Revenue
Revenue in fiscal year 2012 increased approximately 36%, or $4.0 billion, from fiscal year 2011 due primarily to an increase in average
selling price per unit and in total units shipped. Units shipped in fiscal year 2012 increased 13%, or 25 million units, from fiscal year 2011. The
increase in the average selling price to $66 per unit during fiscal year 2012, as compared to $54 per unit in the prior year, was primarily due to
the limited industry supply of hard drives resulting from the severe flooding in Thailand.
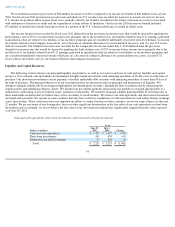
Gross Margin
For fiscal year 2012, gross margin as a percentage of revenue increased to 31% from 20% in the prior fiscal year, primarily due to the
increased selling price per unit throughout most of fiscal year 2012.
49
Fiscal Years Ended
(In millions, except percentages and ASPs)
June 29,
2012
July 1,
2011
July 2,
2010
Net Revenue
$
14,939
$
10,971
$
11,395
Unit Shipments:
Enterprise
29
29
25
Client Compute
156
132
135
Client Non
-
Compute
39
38
33
Total Units Shipped
224
199
193
Industry Units Shipped
600
658
633
ASP (per unit)
$
66
$
54
$
58
Revenues by Channel (%)
OEM
72
%
69
%
71
%
Distributors
21
%
22
%
21
%
Retail
7
%
9
%
8
%
Revenues by Geography (%)
Americas
26
%
29
%
26
%
EMEA
19
%
20
%
22
%
Asia Pacific
55
%
51
%
52
%
Fiscal Years Ended
(Dollars in millions)
June 29,
2012
July 1,
2011
Change
%
Change
Revenue
$
14,939
$
10,971
$
3,968
36
%
Fiscal Years Ended
(Dollars in millions)
June 29,
2012 July 1,
2011 Change %
Change
Cost of revenue
$
10,255
$
8,825
$
1,430
16
%
Gross margin
$
4,684
$
2,146
$
2,538
118
%
Gross margin percentage
31
%
20
%