Seagate 2011 Annual Report Download - page 65
Download and view the complete annual report
Please find page 65 of the 2011 Seagate annual report below. You can navigate through the pages in the report by either clicking on the pages listed below, or by using the keyword search tool below to find specific information within the annual report.-
 1
1 -
2
-
3
-
4
-
5
-
6
-
7
-
8
-
9
-
10
-
11
-
12
-
13
-
14
-
15
-
16
-
17
-
18
-
19
-
20
-
21
-
22
-
23
-
24
-
25
-
26
-
27
-
28
-
29
-
30
-
31
-
32
-
33
-
34
-
35
-
36
-
37
-
38
-
39
-
40
-
41
-
42
-
43
-
44
-
45
-
46
-
47
-
48
-
49
-
50
-
51
-
52
-
53
-
54
-
 55
55 -
 56
56 -
 57
57 -
 58
58 -
 59
59 -
 60
60 -
 61
61 -
 62
62 -
 63
63 -
 64
64 -
 65
65 -
 66
66 -
 67
67 -
 68
68 -
 69
69 -
 70
70 -
 71
71 -
 72
72 -
 73
73 -
 74
74 -
 75
75 -
76
-
77
-
78
-
79
-
80
-
81
-
82
-
83
-
84
-
85
-
86
-
87
-
88
-
89
-
90
-
91
-
92
-
93
-
94
-
95
-
96
-
97
-
98
-
99
-
100
-
101
-
102
-
103
-
104
-
105
-
106
-
107
-
108
-
109
-
110
-
111
-
112
-
113
-
114
-
115
-
116
-
117
-
118
-
119
-
120
-
121
-
122
-
123
-
124
-
125
-
126
-
127
-
128
-
129
-
130
-
131
-
132
-
133
-
134
-
135
-
136
-
137
-
138
-
139
-
140
-
141
-
142
-
143
-
144
-
145
-
146
-
147
-
148
-
149
-
150
-
151
-
152
-
153
-
154
-
155
-
156
-
157
-
158
-
159
-
160
-
161
-
162
-
163
-
164
-
165
-
166
-
167
-
168
-
169
-
170
-
171
-
172
-
173
-
174
-
175
-
176
-
177
-
178
-
179
-
180
-
181
-
182
-
183
-
184
-
185
-
186
-
187
-
188
-
189
 |
 |

Table of Contents
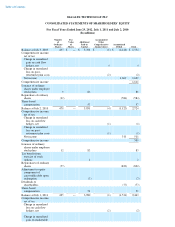
Interest Rate Risk. Our exposure to market risk for changes in interest rates relates primarily to our investment portfolio. At June 29,
2012, with the exception of our auction rate securities, we had no marketable securities that had been in a continuous unrealized loss position for
a period greater than 12 months and determined that no investments were other-than-temporarily impaired. We currently do not use derivative
financial instruments in our investment portfolio.
We have fixed rate debt obligations. We enter into debt obligations for general corporate purposes including capital expenditures and
working capital needs. We currently do not use interest rate derivatives to hedge interest rate exposure on our outstanding debt.
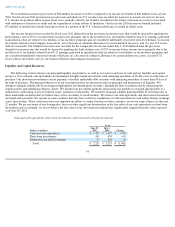
The table below presents principal amounts and related weighted average interest rates by year of maturity for our investment portfolio and
debt obligations as of June 29, 2012. All short-term investments mature in four years or less.
Fiscal Years Ended
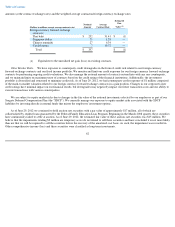
Foreign Currency Exchange Risk. We may enter into foreign currency forward exchange contracts to manage exposure related to certain
foreign currency commitments and anticipated foreign currency denominated expenditures. Our policy prohibits us from entering into derivative
financial instruments for speculative or trading purposes. During fiscal years 2012 and 2011, we did not enter into any hedges of net investments
in foreign operations.
We also hedge a portion of our foreign currency denominated balance sheet positions with foreign currency forward exchange contracts to
reduce the risk that our earnings will be adversely affected by changes in currency exchange rates. The changes in fair value of these hedges are
recognized in earnings in the same period as the gains and losses from the remeasurement of the assets and liabilities. These foreign currency
forward exchange contracts are not designated as hedging instruments under ASC 815, Derivatives and Hedging. All these forward contracts
mature within 12 months.
We evaluate hedging effectiveness prospectively and retrospectively and record any ineffective portion of the hedging instruments in Costs
of Revenue on the Consolidated Statements of Operations. We did not have any material net gains (losses) recognized in Costs of Revenue for
cash flow hedges due to hedge ineffectiveness or discontinued cash flow hedges during fiscal years 2012 and 2011.
(Dollars in
millions, except
percentages)
2013 2014 2015 2016 2017 Thereafter Total
Fair Value
at
June 29, 2012
Assets
Cash
equivalents:
Fixed rate
$
1,533
$
—
$
—
$
—
$
—
$
—
$
1,533
$
1,533
Average
interest
rate
0.14
%
0.14
%
Short
-
term
investments:
Fixed rate
$
61
$
123
$
172
$
26
$
18
$
—
$
400
$
411
Average
interest
rate
0.75
%
0.84
%
1.10
%
0.87
%
1.14
%
0.95
%
Long
-
term
investments:
Variable
rate
$
—
$
—
$
—
$
—
$
—
$
17
$
17
$
15
Average
interest
rate
0.71
%
0.71
%
Total
investment
securities
$
1,594
$
123
$
172
$
26
$
18
$
17
$
1,950
$
1,959
Average
interest
rate
0.16
%
0.84
%
1.10
%
0.87
%
1.14
%
0.71
%
0.31
%
Debt
Fixed rate
$
—
$
319
$
—
$
—
$
600
$
1,950
$
2,869
$
3,146
Average
interest
rate
10.00
%
6.80
%
7.25
%
7.46
%