Seagate 2011 Annual Report Download - page 111
Download and view the complete annual report
Please find page 111 of the 2011 Seagate annual report below. You can navigate through the pages in the report by either clicking on the pages listed below, or by using the keyword search tool below to find specific information within the annual report.-
 1
1 -
2
-
3
-
4
-
5
-
6
-
7
-
8
-
9
-
10
-
11
-
12
-
13
-
14
-
15
-
16
-
17
-
18
-
19
-
20
-
21
-
22
-
23
-
24
-
25
-
26
-
27
-
28
-
29
-
30
-
31
-
32
-
33
-
34
-
35
-
36
-
37
-
38
-
39
-
40
-
41
-
42
-
43
-
44
-
45
-
46
-
47
-
48
-
49
-
50
-
51
-
52
-
53
-
54
-
55
-
56
-
57
-
58
-
59
-
60
-
61
-
62
-
63
-
64
-
65
-
66
-
67
-
68
-
69
-
70
-
71
-
72
-
73
-
74
-
75
-
76
-
77
-
78
-
79
-
80
-
81
-
82
-
83
-
84
-
85
-
86
-
87
-
88
-
89
-
90
-
91
-
92
-
93
-
94
-
95
-
96
-
97
-
98
-
99
-
100
-
 101
101 -
 102
102 -
 103
103 -
 104
104 -
 105
105 -
 106
106 -
 107
107 -
 108
108 -
 109
109 -
 110
110 -
 111
111 -
 112
112 -
 113
113 -
 114
114 -
 115
115 -
 116
116 -
 117
117 -
 118
118 -
 119
119 -
 120
120 -
 121
121 -
122
-
123
-
124
-
125
-
126
-
127
-
128
-
129
-
130
-
131
-
132
-
133
-
134
-
135
-
136
-
137
-
138
-
139
-
140
-
141
-
142
-
143
-
144
-
145
-
146
-
147
-
148
-
149
-
150
-
151
-
152
-
153
-
154
-
155
-
156
-
157
-
158
-
159
-
160
-
161
-
162
-
163
-
164
-
165
-
166
-
167
-
168
-
169
-
170
-
171
-
172
-
173
-
174
-
175
-
176
-
177
-
178
-
179
-
180
-
181
-
182
-
183
-
184
-
185
-
186
-
187
-
188
-
189
 |
 |

Table of Contents
SEAGATE TECHNOLOGY PLC
NOTES TO CONSOLIDATED FINANCIAL STATEMENTS—(Continued)
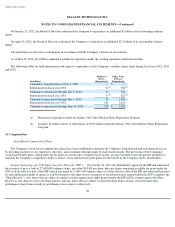
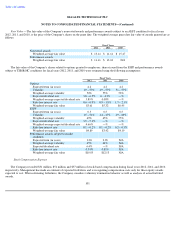
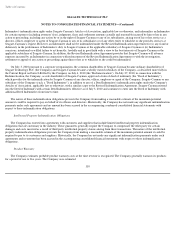
In fiscal years 2012, 2011 and 2010, Dell Inc. accounted for approximately 15%, 13% and 11% of consolidated revenue, respectively, while
Hewlett-
Packard Company accounted for approximately 14%, 15% and 16% of consolidated revenue, respectively. No other customer accounted
for more than 10% of consolidated revenue in any year presented.
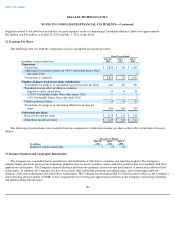
Other long-lived assets consist of property, equipment and leasehold improvements, other intangible assets, capital leases, equity
investments and other non-current assets as recorded by the Company's operations in each area.
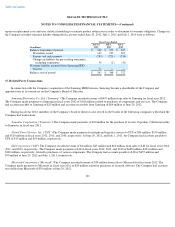
The following table summarizes the Company's operations by geographic area:
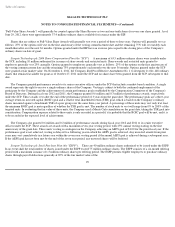
14. Legal, Environmental and Other Contingencies
The Company assesses the probability of an unfavorable outcome of all its material litigation, claims, or assessments to determine whether
a liability had been incurred and whether it is probable that one or more future events will occur confirming the fact of the loss. In the event that
an unfavorable outcome is determined to be probable and the amount of the loss can be reasonably estimated, the Company establishes an
accrual for the litigation, claim or assessment. In addition, in the event an unfavorable outcome is determined to be less than probable, but
reasonably possible, the Company will disclose an estimate of the possible loss or range of such loss; however, when a reasonable estimate
cannot be made, the Company will provide disclosure to that effect. Litigation is inherently uncertain and may result in adverse rulings or
decisions. Additionally, the Company may enter into settlements or be subject to judgments that may, individually or in the aggregate, have a
material adverse effect on its results of operations. Accordingly, actual results could differ materially.
105
Fiscal Years Ended
June 29,
2012
July 1,
2011
July 2,
2010
(In millions)
Revenue from external customers
(1)
:
Singapore
$
7,847
$
5,507
$
5,546
United States
3,845
3,043
3,081
The Netherlands
3,089
2,344
2,728
Other
158
77
40
Consolidated
$
14,939
$
10,971
$
11,395
Long
-
lived assets:
Singapore
$
868
$
748
$
888
Thailand
409
380
287
United States
318
355
369
China
270
277
246
Malaysia
144
173
208
Other
928
462
398
Consolidated
$
2,937
$
2,395
$
2,396
(1)
Revenue is attributed to countries based on the shipping location.