Seagate 2011 Annual Report Download - page 59
Download and view the complete annual report
Please find page 59 of the 2011 Seagate annual report below. You can navigate through the pages in the report by either clicking on the pages listed below, or by using the keyword search tool below to find specific information within the annual report.-
 1
1 -
2
-
3
-
4
-
5
-
6
-
7
-
8
-
9
-
10
-
11
-
12
-
13
-
14
-
15
-
16
-
17
-
18
-
19
-
20
-
21
-
22
-
23
-
24
-
25
-
26
-
27
-
28
-
29
-
30
-
31
-
32
-
33
-
34
-
35
-
36
-
37
-
38
-
39
-
40
-
41
-
42
-
43
-
44
-
45
-
46
-
47
-
48
-
 49
49 -
 50
50 -
 51
51 -
 52
52 -
 53
53 -
 54
54 -
 55
55 -
 56
56 -
 57
57 -
 58
58 -
 59
59 -
 60
60 -
 61
61 -
 62
62 -
 63
63 -
 64
64 -
 65
65 -
 66
66 -
 67
67 -
 68
68 -
 69
69 -
70
-
71
-
72
-
73
-
74
-
75
-
76
-
77
-
78
-
79
-
80
-
81
-
82
-
83
-
84
-
85
-
86
-
87
-
88
-
89
-
90
-
91
-
92
-
93
-
94
-
95
-
96
-
97
-
98
-
99
-
100
-
101
-
102
-
103
-
104
-
105
-
106
-
107
-
108
-
109
-
110
-
111
-
112
-
113
-
114
-
115
-
116
-
117
-
118
-
119
-
120
-
121
-
122
-
123
-
124
-
125
-
126
-
127
-
128
-
129
-
130
-
131
-
132
-
133
-
134
-
135
-
136
-
137
-
138
-
139
-
140
-
141
-
142
-
143
-
144
-
145
-
146
-
147
-
148
-
149
-
150
-
151
-
152
-
153
-
154
-
155
-
156
-
157
-
158
-
159
-
160
-
161
-
162
-
163
-
164
-
165
-
166
-
167
-
168
-
169
-
170
-
171
-
172
-
173
-
174
-
175
-
176
-
177
-
178
-
179
-
180
-
181
-
182
-
183
-
184
-
185
-
186
-
187
-
188
-
189
 |
 |

Table of Contents
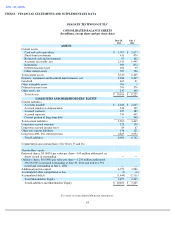
Our cash and cash equivalents, short-term investments and restricted cash and investments decreased from July 1, 2011, primarily as a
result of the repurchase of our ordinary shares, repayments of long term debt, payments made to acquire the Samsung HDD business, capital
expenditures and dividends paid to our shareholders, which were offset by cash provided by operating activities and cash received from the
issuance of ordinary shares under employee stock plans.
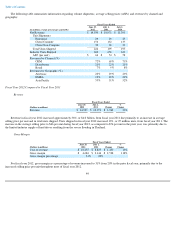
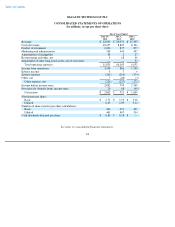
The following table summarizes results of statement of cash flows for the periods indicated:
Cash Provided by Operating Activities
Cash provided by operating activities for fiscal year 2012 was approximately $3.3 billion and includes the effects of net income adjusted for
non-cash items including depreciation, amortization, stock-based compensation, and:
• an increase of $824 million in accounts receivable, net, due to an increase in revenues;
•
an increase of $157 million in accounts payable due to higher direct material purchases related to an increase in volume, partially
offset by a change in supplier payment terms; and
• an increase of $145 million in accrued employee compensation reflecting an increase in variable performance-based
compensation.
Cash provided by operating activities for fiscal year 2011 was approximately $1.3 billion and includes the effects of net income adjusted for
non-cash items including depreciation, amortization, stock-based compensation, impairment of long-lived assets, and:
• an increase of $386 million in accounts payable due to higher direct material purchases related to an increase in volume;
•
an increase of $168 million related to an increase in vendor non
-
trade receivables; and
•
an increase of $115 million in inventories related to an increase in volume.
Cash provided by operating activities for fiscal year 2010 was approximately $1.9 billion and includes the effects of net income adjusted for
non-cash items including depreciation, amortization, stock-based compensation, impairment of long-lived assets, and:
•
an increase of $367 million in accounts receivable due to an increase in revenue; and
• an increase of $170 million in inventories due to an increase in production requirements.
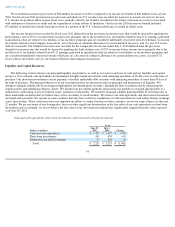
Cash Used in Investing Activities
In fiscal year 2012, we used $1.1 billion for net cash investing activities, which was due primarily to payments for property, equipment and
leasehold improvements of approximately $636 million and net payments for the acquisition of Samsung's HDD business of $561 million.
55
Fiscal Years Ended
(Dollars in millions)
June 29,
2012
July 1,
2011
July 2,
2010
Net cash flow provided by (used in):
Operating activities
$
3,262
$
1,264
$
1,932
Investing activities
(1,114
)
(981
)
(752
)
Financing activities
(3,118
)
131
(344
)
Net (decrease) increase in cash and cash
equivalents
$
(970
)
$
414
$
836