Seagate 2011 Annual Report Download - page 69
Download and view the complete annual report
Please find page 69 of the 2011 Seagate annual report below. You can navigate through the pages in the report by either clicking on the pages listed below, or by using the keyword search tool below to find specific information within the annual report.-
 1
1 -
2
-
3
-
4
-
5
-
6
-
7
-
8
-
9
-
10
-
11
-
12
-
13
-
14
-
15
-
16
-
17
-
18
-
19
-
20
-
21
-
22
-
23
-
24
-
25
-
26
-
27
-
28
-
29
-
30
-
31
-
32
-
33
-
34
-
35
-
36
-
37
-
38
-
39
-
40
-
41
-
42
-
43
-
44
-
45
-
46
-
47
-
48
-
49
-
50
-
51
-
52
-
53
-
54
-
55
-
56
-
57
-
58
-
 59
59 -
 60
60 -
 61
61 -
 62
62 -
 63
63 -
 64
64 -
 65
65 -
 66
66 -
 67
67 -
 68
68 -
 69
69 -
 70
70 -
 71
71 -
 72
72 -
 73
73 -
 74
74 -
 75
75 -
 76
76 -
 77
77 -
 78
78 -
 79
79 -
80
-
81
-
82
-
83
-
84
-
85
-
86
-
87
-
88
-
89
-
90
-
91
-
92
-
93
-
94
-
95
-
96
-
97
-
98
-
99
-
100
-
101
-
102
-
103
-
104
-
105
-
106
-
107
-
108
-
109
-
110
-
111
-
112
-
113
-
114
-
115
-
116
-
117
-
118
-
119
-
120
-
121
-
122
-
123
-
124
-
125
-
126
-
127
-
128
-
129
-
130
-
131
-
132
-
133
-
134
-
135
-
136
-
137
-
138
-
139
-
140
-
141
-
142
-
143
-
144
-
145
-
146
-
147
-
148
-
149
-
150
-
151
-
152
-
153
-
154
-
155
-
156
-
157
-
158
-
159
-
160
-
161
-
162
-
163
-
164
-
165
-
166
-
167
-
168
-
169
-
170
-
171
-
172
-
173
-
174
-
175
-
176
-
177
-
178
-
179
-
180
-
181
-
182
-
183
-
184
-
185
-
186
-
187
-
188
-
189
 |
 |

Table of Contents
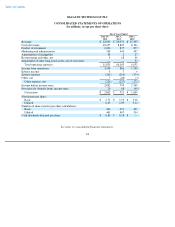
SEAGATE TECHNOLOGY PLC
CONSOLIDATED STATEMENTS OF OPERATIONS
(In millions, except per share data)
See notes to consolidated financial statements.
64
Fiscal Years Ended
June 29,
2012
July 1,
2011
July 2,
2010
Revenue
$
14,939
$
10,971
$
11,395
Cost of revenue
10,255
8,825
8,191
Product development
1,006
875
877
Marketing and administrative
528
445
437
Amortization of intangibles
38
2
27
Restructuring and other, net
4
18
66
Impairment of other long
-
lived assets, net of recoveries
—
—
57
Total operating expenses
11,831
10,165
9,655
Income from operations
3,108
806
1,740
Interest income
8
7
6
Interest expense
(241
)
(214
)
(174
)
Other, net
7
(20
)
(3
)
Other expense, net
(226
)
(227
)
(171
)
Income before income taxes
2,882
579
1,569
Provision for (benefit from) income taxes
20
68
(40
)
Net income
$
2,862
$
511
$
1,609
Net income per share:
Basic
$
6.72
$
1.13
$
3.28
Diluted
6.49
1.09
3.14
Number of shares used in per share calculations:
Basic
426
451
491
Diluted
441
467
514
Cash dividends declared per share
$
0.86
$
0.18
$
—