Seagate 2008 Annual Report Download - page 76
Download and view the complete annual report
Please find page 76 of the 2008 Seagate annual report below. You can navigate through the pages in the report by either clicking on the pages listed below, or by using the keyword search tool below to find specific information within the annual report.-
 1
1 -
2
-
3
-
4
-
5
-
6
-
7
-
8
-
9
-
10
-
11
-
12
-
13
-
14
-
15
-
16
-
17
-
18
-
19
-
20
-
21
-
22
-
23
-
24
-
25
-
26
-
27
-
28
-
29
-
30
-
31
-
32
-
33
-
34
-
35
-
36
-
37
-
38
-
39
-
40
-
41
-
42
-
43
-
44
-
45
-
46
-
47
-
48
-
49
-
50
-
51
-
52
-
53
-
54
-
55
-
56
-
57
-
58
-
59
-
60
-
61
-
62
-
63
-
64
-
65
-
 66
66 -
 67
67 -
 68
68 -
 69
69 -
 70
70 -
 71
71 -
 72
72 -
 73
73 -
 74
74 -
 75
75 -
 76
76 -
 77
77 -
 78
78 -
 79
79 -
 80
80 -
 81
81 -
 82
82 -
 83
83 -
 84
84 -
 85
85 -
 86
86 -
87
-
88
-
89
-
90
-
91
-
92
-
93
-
94
-
95
-
96
-
97
-
98
-
99
-
100
-
101
-
102
-
103
-
104
-
105
-
106
-
107
-
108
-
109
-
110
-
111
-
112
-
113
-
114
-
115
-
116
-
117
-
118
-
119
-
120
-
121
-
122
-
123
-
124
-
125
-
126
-
127
-
128
-
129
-
130
-
131
-
132
-
133
-
134
-
135
-
136
-
137
-
138
-
139
-
140
-
141
-
142
-
143
-
144
-
145
-
146
-
147
-
148
-
149
-
150
-
151
-
152
-
153
-
154
-
155
-
156
-
157
-
158
-
159
-
160
-
161
-
162
-
163
-
164
-
165
-
166
-
167
-
168
-
169
-
170
-
171
-
172
-
173
-
174
-
175
-
176
-
177
-
178
-
179
-
180
-
181
-
182
-
183
-
184
-
185
-
186
-
187
-
188
-
189
-
190
-
191
-
192
-
193
-
194
-
195
-
196
-
197
-
198
-
199
-
200
-
201
-
202
-
203
-
204
-
205
 |
 |

Table of Contents
SEAGATE TECHNOLOGY
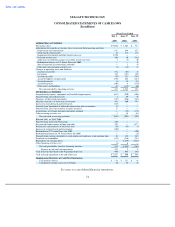
CONSOLIDATED STATEMENTS OF CASH FLOWS
(In millions)
See notes to consolidated financial statements.
74
Fiscal Year Ended
July 3,
2009
June 27,
2008
June 29,
2007
OPERATING ACTIVITIES
Net income (loss)
$
(3,086
)
$
1,262
$
913
Adjustments to reconcile net income (loss) to net cash from operating activities:
Depreciation and amortization
931
844
851
Stock
-
based compensation
83
113
128
Impairment of goodwill and other long
-
lived assets
2,290
—
—
Deferred income taxes
306
10
(365
)
Allowance for doubtful accounts receivable, net of recoveries
4
(3
)
40
Redemption charges on 8% Senior Notes due 2009
—
—
19
Non
-
cash portion of restructuring and other
—
2
19
Other non
-
cash operating activities, net
(5
)
(14
)
21
Changes in operating assets and liabilities:
Accounts receivable
372
(67
)
34
Inventories
358
(151
)
106
Accounts payable
(79
)
351
(391
)
Accrued employee compensation
(296
)
282
(227
)
Accrued warranty
(8
)
15
(15
)
Accrued expenses
(109
)
6
(130
)
Other assets and liabilities
62
(112
)
(60
)
Net cash provided by operating activities
823
2,538
943
INVESTING ACTIVITIES
Acquisition of property, equipment and leasehold improvements
(633
)
(930
)
(906
)
Proceeds from sale of fixed assets
7
29
55
Purchases of short
-
term investments
(155
)
(486
)
(322
)
Maturities and sales of short
-
term investments
192
460
997
Increase in restricted cash and investments
(128
)
—
—
Proceeds from liquidation of deferred compensation plan investments
85
—
—
Proceeds from sale of investments in equity securities
11
—
—
Acquisitions, net of cash and cash equivalents acquired
—
(
78
)
(178
)
Other investing activities, net
3
14
(48
)
Net cash used in investing activities
(618
)
(991
)
(402
)
FINANCING ACTIVITIES
Proceeds from short
-
term borrowings
350
—
—
Net proceeds from issuance of long
-
term debt
399
—
1,477
Retirements and maturities of long
-
term debt
(55
)
(34
)
(5
)
Increase in restricted cash and investments
(380
)
—
—
Redemption of 8% Senior Notes due 2009
—
—
(
400
)
Redemption premium on 8% Senior Notes due 2009
—
—
(
16
)
Proceeds from exercise of employee stock options and employee stock purchase plan
54
178
219
Dividends to shareholders
(132
)
(216
)
(212
)
Repurchases of common shares
—
(
1,479
)
(1,526
)
Other financing activities, net
(4
)
6
—
Net cash provided by (used in) financing activities
232
(1,545
)
(463
)
Increase in cash and cash equivalents
437
2
78
Cash and cash equivalents at the beginning of the year
990
988
910
Cash and cash equivalents at the end of the year
$
1,427
$
990
$
988
Supplemental Disclosure of Cash Flow Information
Cash paid for interest
$
118
$
121
$
88
Cash paid for income taxes, net of refunds
10
34
38