Seagate 2008 Annual Report Download - page 59
Download and view the complete annual report
Please find page 59 of the 2008 Seagate annual report below. You can navigate through the pages in the report by either clicking on the pages listed below, or by using the keyword search tool below to find specific information within the annual report.-
 1
1 -
2
-
3
-
4
-
5
-
6
-
7
-
8
-
9
-
10
-
11
-
12
-
13
-
14
-
15
-
16
-
17
-
18
-
19
-
20
-
21
-
22
-
23
-
24
-
25
-
26
-
27
-
28
-
29
-
30
-
31
-
32
-
33
-
34
-
35
-
36
-
37
-
38
-
39
-
40
-
41
-
42
-
43
-
44
-
45
-
46
-
47
-
48
-
 49
49 -
 50
50 -
 51
51 -
 52
52 -
 53
53 -
 54
54 -
 55
55 -
 56
56 -
 57
57 -
 58
58 -
 59
59 -
 60
60 -
 61
61 -
 62
62 -
 63
63 -
 64
64 -
 65
65 -
 66
66 -
 67
67 -
 68
68 -
 69
69 -
70
-
71
-
72
-
73
-
74
-
75
-
76
-
77
-
78
-
79
-
80
-
81
-
82
-
83
-
84
-
85
-
86
-
87
-
88
-
89
-
90
-
91
-
92
-
93
-
94
-
95
-
96
-
97
-
98
-
99
-
100
-
101
-
102
-
103
-
104
-
105
-
106
-
107
-
108
-
109
-
110
-
111
-
112
-
113
-
114
-
115
-
116
-
117
-
118
-
119
-
120
-
121
-
122
-
123
-
124
-
125
-
126
-
127
-
128
-
129
-
130
-
131
-
132
-
133
-
134
-
135
-
136
-
137
-
138
-
139
-
140
-
141
-
142
-
143
-
144
-
145
-
146
-
147
-
148
-
149
-
150
-
151
-
152
-
153
-
154
-
155
-
156
-
157
-
158
-
159
-
160
-
161
-
162
-
163
-
164
-
165
-
166
-
167
-
168
-
169
-
170
-
171
-
172
-
173
-
174
-
175
-
176
-
177
-
178
-
179
-
180
-
181
-
182
-
183
-
184
-
185
-
186
-
187
-
188
-
189
-
190
-
191
-
192
-
193
-
194
-
195
-
196
-
197
-
198
-
199
-
200
-
201
-
202
-
203
-
204
-
205
 |
 |

Table of Contents
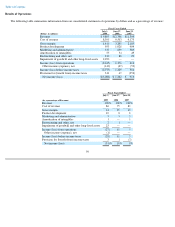
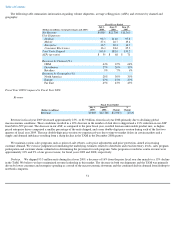
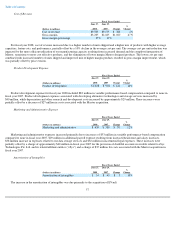
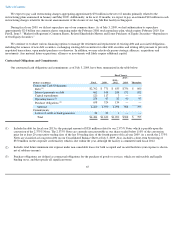
Cost of Revenue
For fiscal year 2008, cost of revenue increased due to a higher number of units shipped and a higher mix of products with higher average
capacities, feature sets, and performance, partially offset by a 10% decline in the average cost per unit. The average cost per unit reduction was
impacted by the more efficient utilization of our manufacturing capacity resulting from increased demand and the completed integration of
Maxtor, transitions to more cost effective products, and the elimination of lower margin Maxtor designed products. The lower cost per unit
combined with increased number of units shipped and improved mix of higher margin products resulted in gross margin improvement, which
was partially offset by price erosion.
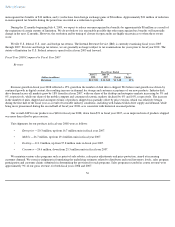
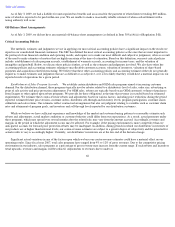
Product Development Expense
Product development expense for fiscal year 2008 included $82 million in variable performance-based compensation compared to none in
fiscal year 2007. Product development expenses associated with developing alternative technologies and storage services increased by
$40 million, while depreciation and other research and development costs increased by approximately $29 million. These increases were
partially offset by a decrease of $27 million in costs associated with the Maxtor acquisition.
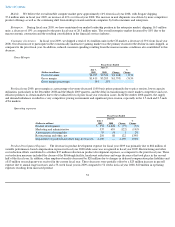
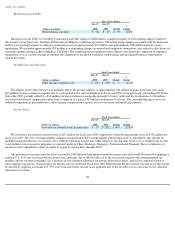
Marketing and Administrative Expense
Marketing and administrative expenses increased primarily due to increases of $53 million in variable performance-based compensation
compared to none in fiscal year 2007, $29 million in additional payroll expense resulting from increased headcount and salary increases,
$38 million increase in expenses related to our data storage services and $32 million in incremental legal expenses. These increases were
partially offset by a charge of approximately $40 million in fiscal year 2007 for the provision of doubtful accounts receivable related to eSys
Technologies Pte. Ltd. and its related affiliate entities ("eSys") and a charge of $35 million for costs associated with the Maxtor acquisition in
fiscal year 2007.
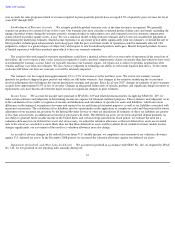
Amortization of Intangibles
The increase in the amortization of intangibles was due primarily to the acquisition of EVault.
57
Fiscal Years Ended
(Dollars in millions)
June 27,
2008
June 29,
2007
Change
%
Change
Cost of revenue
$
9,503
$
9,175
$
328
4
%
Gross margin
$
3,205
$
2,185
$
1,020
47
%
Gross margin percentage
25
%
19
%
Fiscal Years Ended
(Dollars in millions)
June 27,
2008
June 29,
2007
Change
%
Change
Product development
$
1,028
$
904
$
124
14
%
Fiscal Years Ended
(Dollars in millions)
June 27,
2008
June 29,
2007
Change
%
Change
Marketing and administrative
$
659
$
589
$
70
12
%
Fiscal Years Ended
(Dollars in millions)
June 27,
2008
June 29,
2007
Change
%
Change
Amortization of intangibles
$
54
$
49
$
5
10
%