Seagate 2008 Annual Report Download - page 54
Download and view the complete annual report
Please find page 54 of the 2008 Seagate annual report below. You can navigate through the pages in the report by either clicking on the pages listed below, or by using the keyword search tool below to find specific information within the annual report.-
 1
1 -
2
-
3
-
4
-
5
-
6
-
7
-
8
-
9
-
10
-
11
-
12
-
13
-
14
-
15
-
16
-
17
-
18
-
19
-
20
-
21
-
22
-
23
-
24
-
25
-
26
-
27
-
28
-
29
-
30
-
31
-
32
-
33
-
34
-
35
-
36
-
37
-
38
-
39
-
40
-
41
-
42
-
43
-
 44
44 -
 45
45 -
 46
46 -
 47
47 -
 48
48 -
 49
49 -
 50
50 -
 51
51 -
 52
52 -
 53
53 -
 54
54 -
 55
55 -
 56
56 -
 57
57 -
 58
58 -
 59
59 -
 60
60 -
 61
61 -
 62
62 -
 63
63 -
 64
64 -
65
-
66
-
67
-
68
-
69
-
70
-
71
-
72
-
73
-
74
-
75
-
76
-
77
-
78
-
79
-
80
-
81
-
82
-
83
-
84
-
85
-
86
-
87
-
88
-
89
-
90
-
91
-
92
-
93
-
94
-
95
-
96
-
97
-
98
-
99
-
100
-
101
-
102
-
103
-
104
-
105
-
106
-
107
-
108
-
109
-
110
-
111
-
112
-
113
-
114
-
115
-
116
-
117
-
118
-
119
-
120
-
121
-
122
-
123
-
124
-
125
-
126
-
127
-
128
-
129
-
130
-
131
-
132
-
133
-
134
-
135
-
136
-
137
-
138
-
139
-
140
-
141
-
142
-
143
-
144
-
145
-
146
-
147
-
148
-
149
-
150
-
151
-
152
-
153
-
154
-
155
-
156
-
157
-
158
-
159
-
160
-
161
-
162
-
163
-
164
-
165
-
166
-
167
-
168
-
169
-
170
-
171
-
172
-
173
-
174
-
175
-
176
-
177
-
178
-
179
-
180
-
181
-
182
-
183
-
184
-
185
-
186
-
187
-
188
-
189
-
190
-
191
-
192
-
193
-
194
-
195
-
196
-
197
-
198
-
199
-
200
-
201
-
202
-
203
-
204
-
205
 |
 |

Table of Contents
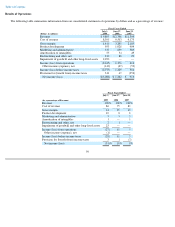
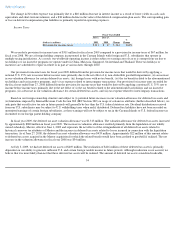
Mobile. We believe the overall mobile compute market grew approximately 16% from fiscal year 2008, with Seagate shipping
37.6 million units in fiscal year 2009, an increase of 41% over fiscal year 2008. The increase in unit shipments was driven by more competitive
product offerings as well as the continuing shift from desktop towards notebook computers by both consumers and enterprises.
Enterprise. During fiscal year 2009, we have maintained our market leadership position in the enterprise market, shipping 16.5 million
units, a decrease of 19% as compared to the prior fiscal year of 20.3 million units. The overall enterprise market decreased by 18% due to the
macroeconomic contraction and the resulting consolidation in the financial services industry.
Consumer electronics. In fiscal year 2009, we shipped a total of 16.4 million units in the CE market, a decrease of 33% from fiscal year
2008. Our decision not to participate in the economically unattractive gaming market was the primary reason for the decline in units shipped, as
compared to the prior fiscal year. In addition, reduced consumer spending resulting from the macroeconomic conditions also contributed to this
decrease.
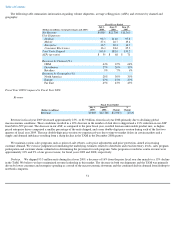
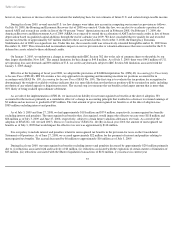
Gross Margin
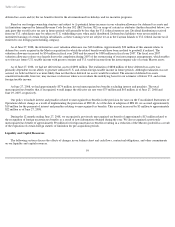
For fiscal year 2009, gross margin as a percentage of revenue decreased 1100 basis points primarily due to price erosion, lower capacity
utilization, particularly in the December 2008 and the March 2009 quarters, and the delay in transitioning to more market-competitive and cost-
efficient products in certain markets due to the residual effects of prior fiscal year execution issues. In the December 2008 quarter, the supply
and demand imbalance resulted in a very competitive pricing environment and significant price erosion, especially in the 3.5-inch and 2.5-inch
ATA markets.
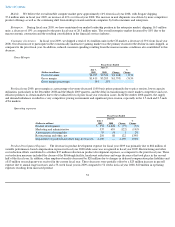
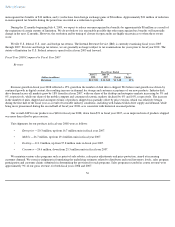
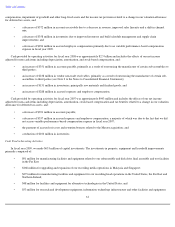
Operating expenses
Product Development Expense. The decrease in product development expense for fiscal year 2009 was primarily due to $82 million of
variable performance-based compensation expense in fiscal year 2008 while none was recognized in fiscal year 2009. Restructuring and other
cost reduction efforts contributed to a further $35 million reduction in product development expenses, as compared to the prior fiscal year. These
cost reduction measures included the closure of the Pittsburgh facility, headcount reductions and wage decreases that took place in the second
half of the fiscal year. In addition, other employee benefits decreased by $20 million due to changes in deferred compensation plan liabilities and
a $13 million research grant was received in the current fiscal year. These decreases were partially offset by a $23 million increase in payroll
expense due to annual wage increases and a 53-week fiscal year in 2009 compared to 52 weeks in fiscal year 2008, $20 million in operating
expenses resulting from increased product
52
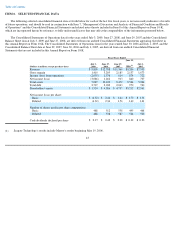
Fiscal Years Ended
(Dollars in millions)
July 3,
2009
June 27,
2008
Change
%
Change
Cost of revenue
$
8,395
$
9,503
$
(1,108
)
(12
)%
Gross margin
$
1,410
$
3,205
$
(1,795
)
(56
)%
Gross margin percentage
14
%
25
%
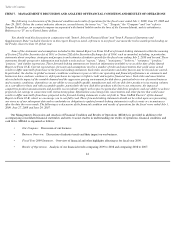
Fiscal Years Ended
(Dollars in millions)
July 3,
2009
June 27,
2008
Change
%
Change
Product development
$
953
$
1,028
$
(75
)
(7
)%
Marketing and administrative
537
659
(122
)
(19
)%
Amortization of intangibles
55
54
1
2
%
Restructuring and other, net
210
88
122
139
%
Impairment of goodwill and other long
-
lived assets
2,290
—
2,290
100
%