Seagate 2008 Annual Report Download - page 72
Download and view the complete annual report
Please find page 72 of the 2008 Seagate annual report below. You can navigate through the pages in the report by either clicking on the pages listed below, or by using the keyword search tool below to find specific information within the annual report.-
 1
1 -
2
-
3
-
4
-
5
-
6
-
7
-
8
-
9
-
10
-
11
-
12
-
13
-
14
-
15
-
16
-
17
-
18
-
19
-
20
-
21
-
22
-
23
-
24
-
25
-
26
-
27
-
28
-
29
-
30
-
31
-
32
-
33
-
34
-
35
-
36
-
37
-
38
-
39
-
40
-
41
-
42
-
43
-
44
-
45
-
46
-
47
-
48
-
49
-
50
-
51
-
52
-
53
-
54
-
55
-
56
-
57
-
58
-
59
-
60
-
61
-
 62
62 -
 63
63 -
 64
64 -
 65
65 -
 66
66 -
 67
67 -
 68
68 -
 69
69 -
 70
70 -
 71
71 -
 72
72 -
 73
73 -
 74
74 -
 75
75 -
 76
76 -
 77
77 -
 78
78 -
 79
79 -
 80
80 -
 81
81 -
 82
82 -
83
-
84
-
85
-
86
-
87
-
88
-
89
-
90
-
91
-
92
-
93
-
94
-
95
-
96
-
97
-
98
-
99
-
100
-
101
-
102
-
103
-
104
-
105
-
106
-
107
-
108
-
109
-
110
-
111
-
112
-
113
-
114
-
115
-
116
-
117
-
118
-
119
-
120
-
121
-
122
-
123
-
124
-
125
-
126
-
127
-
128
-
129
-
130
-
131
-
132
-
133
-
134
-
135
-
136
-
137
-
138
-
139
-
140
-
141
-
142
-
143
-
144
-
145
-
146
-
147
-
148
-
149
-
150
-
151
-
152
-
153
-
154
-
155
-
156
-
157
-
158
-
159
-
160
-
161
-
162
-
163
-
164
-
165
-
166
-
167
-
168
-
169
-
170
-
171
-
172
-
173
-
174
-
175
-
176
-
177
-
178
-
179
-
180
-
181
-
182
-
183
-
184
-
185
-
186
-
187
-
188
-
189
-
190
-
191
-
192
-
193
-
194
-
195
-
196
-
197
-
198
-
199
-
200
-
201
-
202
-
203
-
204
-
205
 |
 |

Table of Contents
spread, on the notional amount of the TRS. The TRS is designed to substantially offset changes in the NQDC plan liability due to changes in the
value of the investment options made by employees. The contract term of the TRS is one year and is settled on a monthly basis therefore limiting
counterparty performance risk. The terms of the TRS required us to pledge initial collateral of $18 million to the counterparty for the term of the
contract. Additional collateral may be posted contingent on the counterparty's exposure to the market value of the TRS. As of July 3, 2009, we
had pledged the initial $18 million to the counterparty and recorded the cash pledged as restricted cash.
During fiscal year 2009, we sold auction rate securities with a par value of $10 million. As of July 3, 2009, we continued to hold auction
rate securities with a par value of approximately $21 million, all of which are collateralized by student loans guaranteed by the Federal Family
Education Loan Program. Beginning in the March 2008 quarter, these securities have continuously failed to settle at auction. As of July 3, 2009,
the estimated fair value of these auction rate securities was $18 million. We believe that the impairments totaling $3 million are temporary given
our ability and intent to hold these securities until liquidity returns to this market or until maturity of these securities. As such, the impairment
was recorded in Other comprehensive income (loss) and these securities were classified as long-term investments.
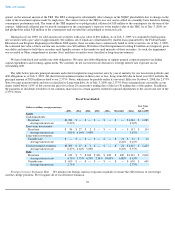
We have both fixed and variable rate debt obligations. We enter into debt obligations to support general corporate purposes including
capital expenditures and working capital needs. We currently do not use interest rate derivatives to hedge interest rate exposure on our
outstanding debt.
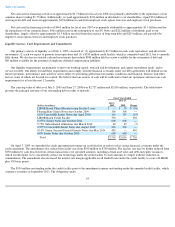
The table below presents principal amounts and related weighted average interest rates by year of maturity for our investment portfolio and
debt obligations as of July 3, 2009. All short-term investments mature in three years or less. Long-term debt due in fiscal year 2013 includes the
principal amount of $326 million related to our 2.375% Notes, which may be payable earlier if converted. Effective October 4, 2008, the 2.375%
Notes became nonconvertible and were reclassified to Long
-term debt. As of July 3, 2009, the 2.375% Notes remained non-convertible as our
shares traded below 110% of the conversion price for at least 20 consecutive trading days of the last 30 trading days of the quarter. In addition,
the payments of dividends to holders of our common shares have in certain quarters resulted in upward adjustments to the conversion rate of the
2.375% Notes.
Fiscal Years Ended
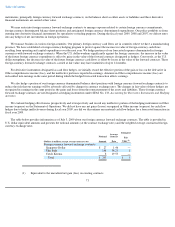
Foreign Currency Exchange Risk. We monitor our foreign currency exposures regularly to ensure the effectiveness of our foreign
currency hedge positions. We recognize all of our derivative financial
70
(Dollars in millions, except percentages)
2010
2011
2012
2013
2014
Thereafter
Total
Fair Value
at
July 3, 2009
Assets
Cash equivalents:
Fixed rate
$
1,281
$
—
$
—
$
—
$
—
$
—
$
1,281
$
1,281
Average interest rate
0.30
%
0.30
%
Short
-
term investments:
Fixed rate
$
84
$
27
$
2
$
—
$
—
$
—
$
113
$
114
Average interest rate
3.03
%
4.64
%
5.00
%
3.45
%
Long
-
term investments:
Variable rate
$
—
$
—
$
—
$
—
$
—
$
21
$
21
$
18
Average interest rate
0.22
%
0.22
%
Total investment securities
$
1,365
$
27
$
2
$
—
$
—
$
21
$
1,415
$
1,413
Average interest rate
0.47
%
4.64
%
5.00
%
0.22
%
0.55
%
Debt
Fixed rate
$
121
$
5
$
630
$
326
$
430
$
600
$
2,112
$
2,010
Average interest rate
6.76
%
5.75
%
6.35
%
2.38
%
10.00
%
6.80
%
6.63
%
Variable rate
$
650
$
—
$
—
$
—
$
—
$
—
$
650
$
649
Average interest rate
2.73
%
2.73
%