Seagate 2008 Annual Report Download - page 53
Download and view the complete annual report
Please find page 53 of the 2008 Seagate annual report below. You can navigate through the pages in the report by either clicking on the pages listed below, or by using the keyword search tool below to find specific information within the annual report.-
 1
1 -
2
-
3
-
4
-
5
-
6
-
7
-
8
-
9
-
10
-
11
-
12
-
13
-
14
-
15
-
16
-
17
-
18
-
19
-
20
-
21
-
22
-
23
-
24
-
25
-
26
-
27
-
28
-
29
-
30
-
31
-
32
-
33
-
34
-
35
-
36
-
37
-
38
-
39
-
40
-
41
-
42
-
 43
43 -
 44
44 -
 45
45 -
 46
46 -
 47
47 -
 48
48 -
 49
49 -
 50
50 -
 51
51 -
 52
52 -
 53
53 -
 54
54 -
 55
55 -
 56
56 -
 57
57 -
 58
58 -
 59
59 -
 60
60 -
 61
61 -
 62
62 -
 63
63 -
64
-
65
-
66
-
67
-
68
-
69
-
70
-
71
-
72
-
73
-
74
-
75
-
76
-
77
-
78
-
79
-
80
-
81
-
82
-
83
-
84
-
85
-
86
-
87
-
88
-
89
-
90
-
91
-
92
-
93
-
94
-
95
-
96
-
97
-
98
-
99
-
100
-
101
-
102
-
103
-
104
-
105
-
106
-
107
-
108
-
109
-
110
-
111
-
112
-
113
-
114
-
115
-
116
-
117
-
118
-
119
-
120
-
121
-
122
-
123
-
124
-
125
-
126
-
127
-
128
-
129
-
130
-
131
-
132
-
133
-
134
-
135
-
136
-
137
-
138
-
139
-
140
-
141
-
142
-
143
-
144
-
145
-
146
-
147
-
148
-
149
-
150
-
151
-
152
-
153
-
154
-
155
-
156
-
157
-
158
-
159
-
160
-
161
-
162
-
163
-
164
-
165
-
166
-
167
-
168
-
169
-
170
-
171
-
172
-
173
-
174
-
175
-
176
-
177
-
178
-
179
-
180
-
181
-
182
-
183
-
184
-
185
-
186
-
187
-
188
-
189
-
190
-
191
-
192
-
193
-
194
-
195
-
196
-
197
-
198
-
199
-
200
-
201
-
202
-
203
-
204
-
205
 |
 |

Table of Contents
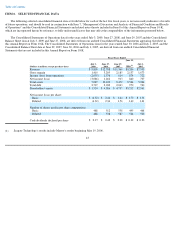
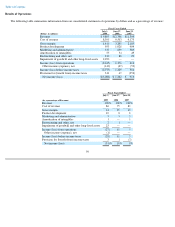
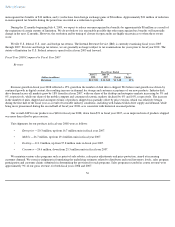
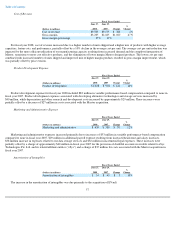
The following table summarizes information regarding volume shipments, average selling prices (ASPs) and revenues by channel and
geography:
Fiscal Year 2009 Compared to Fiscal Year 2008
Revenue
Revenue in fiscal year 2009 decreased approximately 23%, or $2.9 billion, from fiscal year 2008 primarily due to declining global
macroeconomic conditions. These conditions resulted in a 10% decrease in the number of disk drives shipped and a 13% reduction in our ASP
from $68 to $59 per unit. The decrease in our ASP, as compared to the prior fiscal year, resulted from an unfavorable product mix, as higher-
priced enterprise drives comprised a smaller percentage of the units shipped, and a near double-digit price erosion during each of the first two
quarters of fiscal year 2009. The near double-digit price erosion we experienced was due to time-to-market delays in certain markets and a
supply and demand imbalance resulting from a sharp decline in the TAM in the December 2008 quarter.
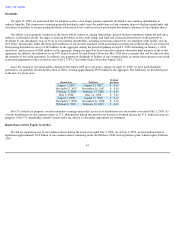
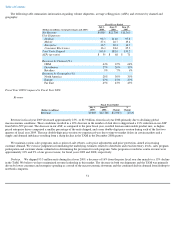
We maintain various sales programs such as point-of-sale rebates, sales price adjustments and price protection, aimed at increasing
customer demand. We exercise judgment in formulating the underlying estimates related to distributor and retail inventory levels, sales program
participation and customer claims submittals in determining the provision for such programs. Sales programs recorded as contra revenue were
approximately 12% and 9% of our gross revenue, for fiscal years 2009 and 2008, respectively.
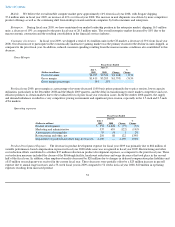
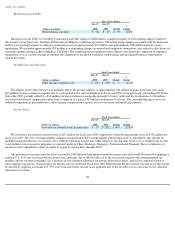
Desktop.
We shipped 93.3 million units during fiscal year 2009, a decrease of 16% from the prior fiscal year due mainly to a 13% decline
in the TAM. We believe we have maintained revenue leadership in this market. The decrease in both our shipments and the TAM was primarily
driven by lower consumer and enterprise spending as a result of the macroeconomic downturn and the continued shift in demand from desktop to
notebook computers.
51
Fiscal Years Ended
(Dollars in millions, except percentages and ASPs)
July 3,
2009
June 27,
2008
June 29,
2007
Net Revenue
$
9,805
$
12,708
$
11,360
Unit Shipments:
Desktop
93.3
111.0
97.8
Mobile
37.6
26.7
19.4
Enterprise
16.5
20.3
16.7
Consumer Electronics
16.4
24.6
25.3
Total Units Shipped
163.8
182.6
159.2
ASPs (per unit)
$
59
$
68
$
71
Revenues by Channel (%)
OEM
64
%
67
%
64
%
Distributors
27
%
26
%
30
%
Retailers
9
%
7
%
6
%
Revenues by Geography (%)
North America
28
%
30
%
30
%
Europe
27
%
27
%
27
%
Far East
45
%
43
%
43
%
Fiscal Years Ended
(Dollars in millions)
July 3,
2009
June 27,
2008
Change
%
Change
Revenue
$
9,805
$
12,708
$
(2,903
)
(23
)%