Seagate 2008 Annual Report Download - page 75
Download and view the complete annual report
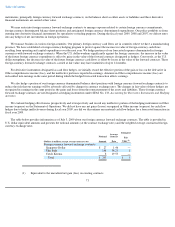
Please find page 75 of the 2008 Seagate annual report below. You can navigate through the pages in the report by either clicking on the pages listed below, or by using the keyword search tool below to find specific information within the annual report.-
 1
1 -
2
-
3
-
4
-
5
-
6
-
7
-
8
-
9
-
10
-
11
-
12
-
13
-
14
-
15
-
16
-
17
-
18
-
19
-
20
-
21
-
22
-
23
-
24
-
25
-
26
-
27
-
28
-
29
-
30
-
31
-
32
-
33
-
34
-
35
-
36
-
37
-
38
-
39
-
40
-
41
-
42
-
43
-
44
-
45
-
46
-
47
-
48
-
49
-
50
-
51
-
52
-
53
-
54
-
55
-
56
-
57
-
58
-
59
-
60
-
61
-
62
-
63
-
64
-
 65
65 -
 66
66 -
 67
67 -
 68
68 -
 69
69 -
 70
70 -
 71
71 -
 72
72 -
 73
73 -
 74
74 -
 75
75 -
 76
76 -
 77
77 -
 78
78 -
 79
79 -
 80
80 -
 81
81 -
 82
82 -
 83
83 -
 84
84 -
 85
85 -
86
-
87
-
88
-
89
-
90
-
91
-
92
-
93
-
94
-
95
-
96
-
97
-
98
-
99
-
100
-
101
-
102
-
103
-
104
-
105
-
106
-
107
-
108
-
109
-
110
-
111
-
112
-
113
-
114
-
115
-
116
-
117
-
118
-
119
-
120
-
121
-
122
-
123
-
124
-
125
-
126
-
127
-
128
-
129
-
130
-
131
-
132
-
133
-
134
-
135
-
136
-
137
-
138
-
139
-
140
-
141
-
142
-
143
-
144
-
145
-
146
-
147
-
148
-
149
-
150
-
151
-
152
-
153
-
154
-
155
-
156
-
157
-
158
-
159
-
160
-
161
-
162
-
163
-
164
-
165
-
166
-
167
-
168
-
169
-
170
-
171
-
172
-
173
-
174
-
175
-
176
-
177
-
178
-
179
-
180
-
181
-
182
-
183
-
184
-
185
-
186
-
187
-
188
-
189
-
190
-
191
-
192
-
193
-
194
-
195
-
196
-
197
-
198
-
199
-
200
-
201
-
202
-
203
-
204
-
205
 |
 |

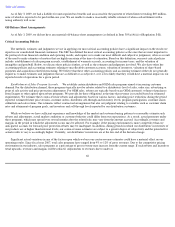
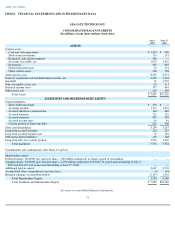
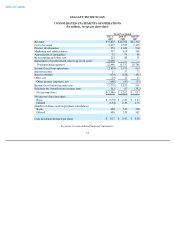
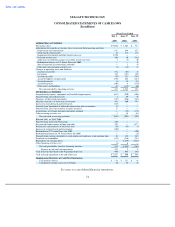
Table of Contents
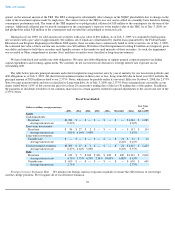
SEAGATE TECHNOLOGY
CONSOLIDATED STATEMENTS OF OPERATIONS
(In millions, except per share data)
See notes to consolidated financial statements.
73
Fiscal Year Ended
July 3,
2009
June 27,
2008
June 29,
2007
Revenue
$
9,805
$
12,708
$
11,360
Cost of revenue
8,395
9,503
9,175
Product development
953
1,028
904
Marketing and administrative
537
659
589
Amortization of intangibles
55
54
49
Restructuring and other, net
210
88
29
Impairment of goodwill and other long
-
lived assets
2,290
—
—
Total operating expenses
12,440
11,332
10,746
Income (loss) from operations
(2,635
)
1,376
614
Interest income
17
57
73
Interest expense
(134
)
(126
)
(141
)
Other, net
(23
)
22
15
Other income (expense), net
(140
)
(47
)
(53
)
Income (loss) before income taxes
(2,775
)
1,329
561
Provision for (benefit from) income taxes
311
67
(352
)
Net income (loss)
$
(3,086
)
$
1,262
$
913
Net income (loss) per share:
Basic
$
(6.32
)
$
2.46
$
1.64
Diluted
(6.32
)
2.36
1.56
Number of shares used in per share calculations:
Basic
488
512
558
Diluted
488
538
587
Cash dividends declared per share
$
0.27
$
0.42
$
0.38