Seagate 2008 Annual Report Download - page 45
Download and view the complete annual report
Please find page 45 of the 2008 Seagate annual report below. You can navigate through the pages in the report by either clicking on the pages listed below, or by using the keyword search tool below to find specific information within the annual report.-
 1
1 -
2
-
3
-
4
-
5
-
6
-
7
-
8
-
9
-
10
-
11
-
12
-
13
-
14
-
15
-
16
-
17
-
18
-
19
-
20
-
21
-
22
-
23
-
24
-
25
-
26
-
27
-
28
-
29
-
30
-
31
-
32
-
33
-
34
-
 35
35 -
 36
36 -
 37
37 -
 38
38 -
 39
39 -
 40
40 -
 41
41 -
 42
42 -
 43
43 -
 44
44 -
 45
45 -
 46
46 -
 47
47 -
 48
48 -
 49
49 -
 50
50 -
 51
51 -
 52
52 -
 53
53 -
 54
54 -
 55
55 -
56
-
57
-
58
-
59
-
60
-
61
-
62
-
63
-
64
-
65
-
66
-
67
-
68
-
69
-
70
-
71
-
72
-
73
-
74
-
75
-
76
-
77
-
78
-
79
-
80
-
81
-
82
-
83
-
84
-
85
-
86
-
87
-
88
-
89
-
90
-
91
-
92
-
93
-
94
-
95
-
96
-
97
-
98
-
99
-
100
-
101
-
102
-
103
-
104
-
105
-
106
-
107
-
108
-
109
-
110
-
111
-
112
-
113
-
114
-
115
-
116
-
117
-
118
-
119
-
120
-
121
-
122
-
123
-
124
-
125
-
126
-
127
-
128
-
129
-
130
-
131
-
132
-
133
-
134
-
135
-
136
-
137
-
138
-
139
-
140
-
141
-
142
-
143
-
144
-
145
-
146
-
147
-
148
-
149
-
150
-
151
-
152
-
153
-
154
-
155
-
156
-
157
-
158
-
159
-
160
-
161
-
162
-
163
-
164
-
165
-
166
-
167
-
168
-
169
-
170
-
171
-
172
-
173
-
174
-
175
-
176
-
177
-
178
-
179
-
180
-
181
-
182
-
183
-
184
-
185
-
186
-
187
-
188
-
189
-
190
-
191
-
192
-
193
-
194
-
195
-
196
-
197
-
198
-
199
-
200
-
201
-
202
-
203
-
204
-
205
 |
 |

Table of Contents
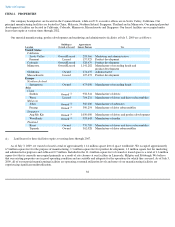
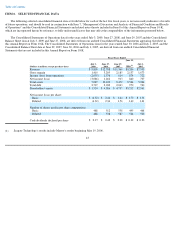
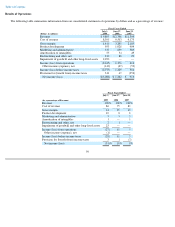
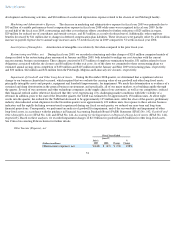
ITEM 6. SELECTED FINANCIAL DATA
The following selected consolidated financial data set forth below for each of the last five fiscal years, is not necessarily indicative of results
of future operations, and should be read in conjunction with Item 7, "Management's Discussion and Analysis of Financial Condition and Results
of Operations" and the Consolidated Financial Statements and related notes thereto included in Item 8 of this Annual Report on Form 10-K,
which are incorporated herein by reference, to fully understand factors that may affect the comparability of the information presented below.
The Consolidated Statements of Operations data for the years ended July 3, 2009, June 27, 2008, and June 29, 2007 and the Consolidated
Balance Sheet data at July 3, 2009 and June 27, 2008, are derived from our audited Consolidated Financial Statements appearing elsewhere in
this Annual Report on Form 10-K. The Consolidated Statements of Operations data for the years ended June 30, 2006 and July 1, 2005, and the
Consolidated Balance Sheet data at June 29, 2007, June 30, 2006 and July 1, 2005, are derived from our audited Consolidated Financial
Statements that are not included in this Annual Report on Form 10-K.
(1)
Fiscal Years Ended
(Dollars in millions, except per share data)
July 3,
2009
June 27,
2008
June 29,
2007
June 30,
2006
(1)
July 1,
2005
Revenue
$
9,805
$
12,708
$
11,360
$
9,206
$
7,553
Gross margin
1,410
3,205
2,185
2,137
1,673
Income (loss) from operations
(2,635
)
1,376
614
874
722
Net income (loss)
(3,086
)
1,262
913
840
707
Total assets
7,087
10,120
9,472
9,544
5,244
Total debt
2,727
2,030
2,063
970
740
Shareholders' equity
$
1,524
$
4,586
$
4,737
$
5,212
$
2,541
Net income (loss) per share:
Basic
$
(6.32
)
$
2.46
$
1.64
$
1.70
$
1.51
Diluted
(6.32
)
2.36
1.56
1.60
1.41
Number of shares used in per share computations:
Basic
488
512
558
495
468
Diluted
488
538
587
524
502
Cash dividends declared per share
$
0.27
$
0.42
$
0.38
$
0.32
$
0.26
Seagate Technology's results include Maxtor's results beginning May 19, 2006.
43