Salesforce.com 2014 Annual Report Download - page 86
Download and view the complete annual report
Please find page 86 of the 2014 Salesforce.com annual report below. You can navigate through the pages in the report by either clicking on the pages listed below, or by using the keyword search tool below to find specific information within the annual report.-
 1
1 -
2
-
3
-
4
-
5
-
6
-
7
-
8
-
9
-
10
-
11
-
12
-
13
-
14
-
15
-
16
-
17
-
18
-
19
-
20
-
21
-
22
-
23
-
24
-
25
-
26
-
27
-
28
-
29
-
30
-
31
-
32
-
33
-
34
-
35
-
36
-
37
-
38
-
39
-
40
-
41
-
42
-
43
-
44
-
45
-
46
-
47
-
48
-
49
-
50
-
51
-
52
-
53
-
54
-
55
-
56
-
57
-
58
-
59
-
60
-
61
-
62
-
63
-
64
-
65
-
66
-
67
-
68
-
69
-
70
-
71
-
72
-
73
-
74
-
75
-
 76
76 -
 77
77 -
 78
78 -
 79
79 -
 80
80 -
 81
81 -
 82
82 -
 83
83 -
 84
84 -
 85
85 -
 86
86 -
 87
87 -
 88
88 -
 89
89 -
 90
90 -
 91
91 -
 92
92 -
 93
93 -
 94
94 -
 95
95 -
 96
96 -
97
-
98
-
99
-
100
-
101
-
102
-
103
-
104
-
105
-
106
-
107
-
108
-
109
-
110
-
111
-
112
-
113
-
114
-
115
-
116
-
117
-
118
-
119
-
120
-
121
-
122
-
123
-
124
-
125
-
126
-
127
-
128
 |
 |

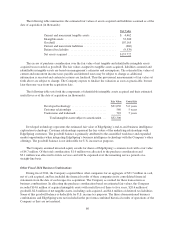
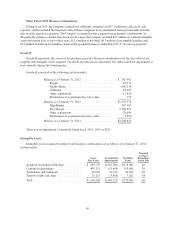
As of January 31, 2014 and 2013, the carrying value of the Company’s investments in privately-held
companies was $77.0 million and $46.8 million, respectively. These investments are recorded in other assets, net
on the consolidated balance sheets.
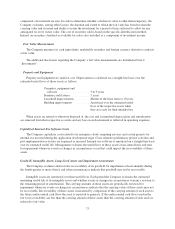
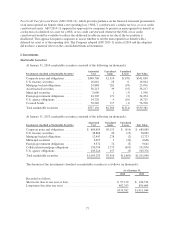
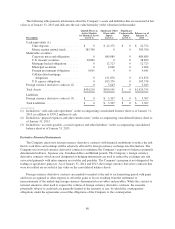
Investment Income
Investment income consists of interest income, realized gains, and realized losses on the Company’s cash,
cash equivalents and marketable securities. The components of investment income are presented below (in
thousands):
Fiscal Year Ended January 31,
2014 2013 2012
Interest income .................................. $ 9,512 $17,903 $20,791
Realized gains ................................... 5,952 5,007 6,542
Realized losses .................................. (5,246) (3,348) (4,065)
Total investment income ........................... $10,218 $19,562 $23,268
Reclassification adjustments out of accumulated other comprehensive loss into net loss were immaterial for
fiscal 2014, 2013 and 2012, respectively.
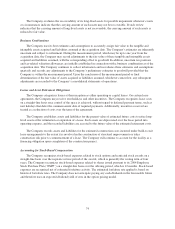
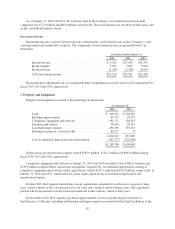
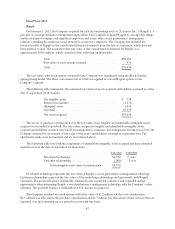
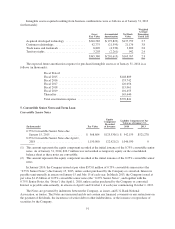
3. Property and Equipment
Property and equipment consisted of the following (in thousands):
As of January 31,
2014 2013
Land .......................................... $ 248,263 $ 248,263
Building improvements ........................... 49,572 49,572
Computers, equipment and software ................. 931,171 328,318
Furniture and fixtures ............................. 58,956 38,275
Leasehold improvements .......................... 296,390 193,181
Building in progress—leased facility ................. 40,171 0
1,624,523 857,609
Less accumulated depreciation and amortization ........ (383,777) (252,940)
$1,240,746 $ 604,669
Depreciation and amortization expense totaled $185.9 million, $101.1 million and $69.8 million during
fiscal 2014, 2013 and 2012, respectively.
Computers, equipment and software at January 31, 2014 and 2013 included a total of $612.0 million and
$136.9 million acquired under capital lease agreements, respectively. Accumulated amortization relating to
computers, equipment and software under capital leases totaled $109.1 million and $57.8 million, respectively, at
January 31, 2014 and 2013. Amortization of assets under capital leases is included in depreciation and
amortization expense.
In June 2013, the Company entered into a large capital lease agreement for software for a period of nine
years, which consists of the contractual term of six years and a renewal option of three years. The capitalized
portion will be depreciated over the estimated useful life of the software, which is nine years.
In November 2010, the Company purchased approximately 14 acres of undeveloped real estate in
San Francisco, California, including entitlements and improvements associated with the land. In addition to the
82