Salesforce.com 2014 Annual Report Download - page 55
Download and view the complete annual report
Please find page 55 of the 2014 Salesforce.com annual report below. You can navigate through the pages in the report by either clicking on the pages listed below, or by using the keyword search tool below to find specific information within the annual report.-
 1
1 -
2
-
3
-
4
-
5
-
6
-
7
-
8
-
9
-
10
-
11
-
12
-
13
-
14
-
15
-
16
-
17
-
18
-
19
-
20
-
21
-
22
-
23
-
24
-
25
-
26
-
27
-
28
-
29
-
30
-
31
-
32
-
33
-
34
-
35
-
36
-
37
-
38
-
39
-
40
-
41
-
42
-
43
-
44
-
 45
45 -
 46
46 -
 47
47 -
 48
48 -
 49
49 -
 50
50 -
 51
51 -
 52
52 -
 53
53 -
 54
54 -
 55
55 -
 56
56 -
 57
57 -
 58
58 -
 59
59 -
 60
60 -
 61
61 -
 62
62 -
 63
63 -
 64
64 -
 65
65 -
66
-
67
-
68
-
69
-
70
-
71
-
72
-
73
-
74
-
75
-
76
-
77
-
78
-
79
-
80
-
81
-
82
-
83
-
84
-
85
-
86
-
87
-
88
-
89
-
90
-
91
-
92
-
93
-
94
-
95
-
96
-
97
-
98
-
99
-
100
-
101
-
102
-
103
-
104
-
105
-
106
-
107
-
108
-
109
-
110
-
111
-
112
-
113
-
114
-
115
-
116
-
117
-
118
-
119
-
120
-
121
-
122
-
123
-
124
-
125
-
126
-
127
-
128
 |
 |

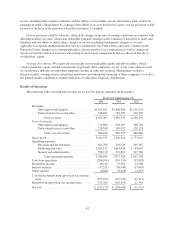
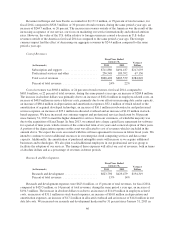
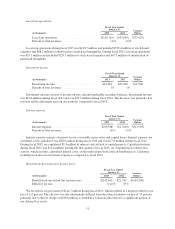
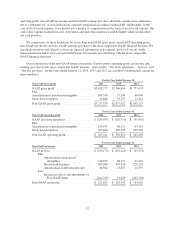
Loss from operations.
Fiscal Year Ended
January 31, Variance
Dollars(in thousands) 2013 2012
Loss from operations .......................... $(110,710) $(35,085) $(75,625)
Percent of total revenues ....................... (4)% (2)%
Loss from operations during fiscal 2013 was $110.7 million and included $379.4 million of stock-based
expenses and $88.2 million of amortization of purchased intangibles. During fiscal 2012, loss from operations
was $35.1 million and included $229.3 million of stock-based expenses and $67.3 million of amortization of
purchased intangibles.
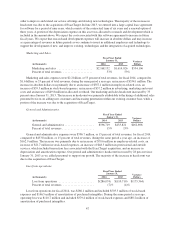
Investment income.
Fiscal Year Ended
January 31, Variance
Dollars(in thousands) 2013 2012
Investment income ............................ $19,562 $23,268 $(3,706)
Percent of total revenues ........................ 1% 1%
Investment income consists of income on our cash and marketable securities balances. Investment income
was $19.6 million during fiscal 2013 and was $23.3 million during fiscal 2012. The decrease was primarily due
to lower yields and interest rates on our portfolio compared to fiscal 2012.
Interest expense.
Fiscal Year Ended
January 31, Variance
Dollars(in thousands) 2013 2012
Interest expense .............................. $(30,948) $(17,045) $(13,903)
Percent of total revenues ....................... (1)% (1)%
Interest expense consists of interest on our convertible senior notes and capital leases. Interest expense, net
of interest costs capitalized, was $30.9 million during fiscal 2013 and was $17.0 million during fiscal 2012.
During fiscal 2013, we capitalized $2.4 million of interest costs related to capital projects. Capitalized interest
during fiscal 2012 was $14.6 million. During the first quarter of fiscal 2013, we suspended pre-construction
activity, which includes capitalized interest costs, on the undeveloped real estate in San Francisco, California
resulting in an increase in interest expense as compared to fiscal 2012.
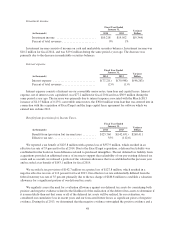
Benefit from (provision for) income taxes.
Fiscal Year Ended
January 31, Variance
Dollars(in thousands) 2013 2012
Benefit from (provision for) income taxes ......... $(142,651) $21,745 $(164,396)
Effective tax rate ............................. (112)% 65%
We recorded a tax provision of $142.7 million during fiscal 2013, which resulted in a negative effective tax
rate of 112 percent. The effective tax rate substantially differed from the federal statutory tax rate of 35 percent
primarily due to the tax charge of $186.8 million to establish a valuation allowance for a significant portion of
our deferred tax assets.
51