Salesforce.com 2014 Annual Report Download - page 62
Download and view the complete annual report
Please find page 62 of the 2014 Salesforce.com annual report below. You can navigate through the pages in the report by either clicking on the pages listed below, or by using the keyword search tool below to find specific information within the annual report.-
 1
1 -
2
-
3
-
4
-
5
-
6
-
7
-
8
-
9
-
10
-
11
-
12
-
13
-
14
-
15
-
16
-
17
-
18
-
19
-
20
-
21
-
22
-
23
-
24
-
25
-
26
-
27
-
28
-
29
-
30
-
31
-
32
-
33
-
34
-
35
-
36
-
37
-
38
-
39
-
40
-
41
-
42
-
43
-
44
-
45
-
46
-
47
-
48
-
49
-
50
-
51
-
 52
52 -
 53
53 -
 54
54 -
 55
55 -
 56
56 -
 57
57 -
 58
58 -
 59
59 -
 60
60 -
 61
61 -
 62
62 -
 63
63 -
 64
64 -
 65
65 -
 66
66 -
 67
67 -
 68
68 -
 69
69 -
 70
70 -
 71
71 -
 72
72 -
73
-
74
-
75
-
76
-
77
-
78
-
79
-
80
-
81
-
82
-
83
-
84
-
85
-
86
-
87
-
88
-
89
-
90
-
91
-
92
-
93
-
94
-
95
-
96
-
97
-
98
-
99
-
100
-
101
-
102
-
103
-
104
-
105
-
106
-
107
-
108
-
109
-
110
-
111
-
112
-
113
-
114
-
115
-
116
-
117
-
118
-
119
-
120
-
121
-
122
-
123
-
124
-
125
-
126
-
127
-
128
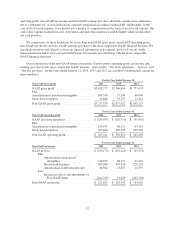
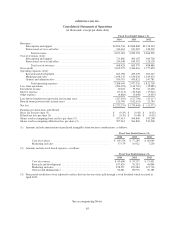
 |
 |

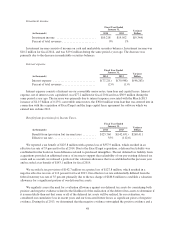
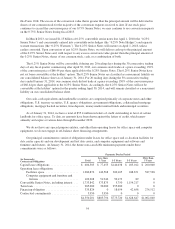
For the Year Ended January 31,
Non-GAAP diluted earnings per share(a) 2014 2013 2012
GAAP diluted loss per share ................ $ (0.39) $ (0.48) $ (0.02)
Plus:
Amortization of purchased
intangibles .................... 0.23 0.15 0.12
Stock-based expenses ............. 0.79 0.64 0.40
Amortization of debt discount, net . . . 0.07 0.04 0.02
Less:
Income tax effects and adjustments of
Non-GAAP items .............. (0.35) 0.06 (0.18)
Non-GAAP diluted earnings per share ........ $ 0.35 $ 0.41 $ 0.34
Shares used in computing diluted net income per
share ................................ 635,688 596,280 569,180
(a) Prior period results have been adjusted to reflect the four-for-one stock split of our common stock through a
stock dividend which occurred in April 2013.
The effects of dilutive securities were not included in the GAAP calculation of diluted earnings/loss per
share for the years ended January 31, 2014, 2013 and 2012 because we had a net loss for those periods and the
effect would have been anti-dilutive. The following table reflects the effect of the dilutive securities on the basic
share count used in the GAAP earnings/loss per share calculation to derive the share count used for the non-
GAAP diluted earnings per share:
For the Year Ended January 31,
Supplemental Diluted Sharecount Information (in thousands): 2014 2013 2012
Weighted-average shares outstanding for GAAP basic
earnings per share .............................. 597,613 564,896 541,208
Effect of dilutive securities:
Convertible senior notes ....................... 14,550 11,360 9,052
Warrants associated with the convertible senior note
hedges ................................... 9,658 5,132 2,212
Employee stock awards ....................... 13,867 14,892 16,708
Adjusted weighted-average shares outstanding and
assumed conversions for Non-GAAP diluted earnings
per share ..................................... 635,688 596,280 569,180
58