Salesforce.com 2014 Annual Report Download - page 69
Download and view the complete annual report
Please find page 69 of the 2014 Salesforce.com annual report below. You can navigate through the pages in the report by either clicking on the pages listed below, or by using the keyword search tool below to find specific information within the annual report.-
 1
1 -
2
-
3
-
4
-
5
-
6
-
7
-
8
-
9
-
10
-
11
-
12
-
13
-
14
-
15
-
16
-
17
-
18
-
19
-
20
-
21
-
22
-
23
-
24
-
25
-
26
-
27
-
28
-
29
-
30
-
31
-
32
-
33
-
34
-
35
-
36
-
37
-
38
-
39
-
40
-
41
-
42
-
43
-
44
-
45
-
46
-
47
-
48
-
49
-
50
-
51
-
52
-
53
-
54
-
55
-
56
-
57
-
58
-
 59
59 -
 60
60 -
 61
61 -
 62
62 -
 63
63 -
 64
64 -
 65
65 -
 66
66 -
 67
67 -
 68
68 -
 69
69 -
 70
70 -
 71
71 -
 72
72 -
 73
73 -
 74
74 -
 75
75 -
 76
76 -
 77
77 -
 78
78 -
 79
79 -
80
-
81
-
82
-
83
-
84
-
85
-
86
-
87
-
88
-
89
-
90
-
91
-
92
-
93
-
94
-
95
-
96
-
97
-
98
-
99
-
100
-
101
-
102
-
103
-
104
-
105
-
106
-
107
-
108
-
109
-
110
-
111
-
112
-
113
-
114
-
115
-
116
-
117
-
118
-
119
-
120
-
121
-
122
-
123
-
124
-
125
-
126
-
127
-
128
 |
 |

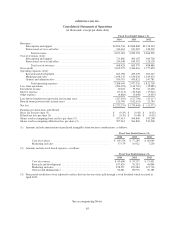
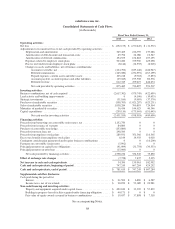
salesforce.com, inc.
Consolidated Statements of Operations
(in thousands, except per share data)
Fiscal Year Ended January 31,
2014 2013 2012
Revenues:
Subscription and support ........................................... $3,824,542 $2,868,808 $2,126,234
Professional services and other ...................................... 246,461 181,387 140,305
Total revenues ............................................... 4,071,003 3,050,195 2,266,539
Cost of revenues (1)(2):
Subscription and support ........................................... 711,880 494,187 360,758
Professional services and other ...................................... 256,548 189,392 128,128
Total cost of revenues ......................................... 968,428 683,579 488,886
Gross profit .......................................................... 3,102,575 2,366,616 1,777,653
Operating expenses (1)(2):
Research and development .......................................... 623,798 429,479 295,347
Marketing and sales ............................................... 2,168,132 1,614,026 1,169,610
General and administrative .......................................... 596,719 433,821 347,781
Total operating expenses ....................................... 3,388,649 2,477,326 1,812,738
Loss from operations .................................................. (286,074) (110,710) (35,085)
Investment income .................................................... 10,218 19,562 23,268
Interest expense ...................................................... (77,211) (30,948) (17,045)
Other expense ........................................................ (4,868) (5,698) (4,455)
Loss before benefit from (provision for) income taxes ........................ (357,935) (127,794) (33,317)
Benefit from (provision for) income taxes .................................. 125,760 (142,651) 21,745
Net loss ............................................................. $ (232,175) $ (270,445) $ (11,572)
Earnings per share-basic and diluted:
Basic net loss per share (3) .............................................. $ (0.39) $ (0.48) $ (0.02)
Diluted net loss per share (3) ............................................ $ (0.39) $ (0.48) $ (0.02)
Shares used in computing basic net loss per share (3) ......................... 597,613 564,896 541,208
Shares used in computing diluted net loss per share (3) ....................... 597,613 564,896 541,208
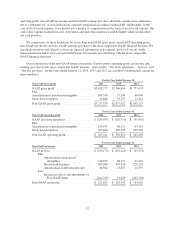
(1) Amounts include amortization of purchased intangibles from business combinations, as follows:
Fiscal Year Ended January 31,
2014 2013 2012
Cost of revenues ............................................. $ 109,356 $ 77,249 $ 60,069
Marketing and sales .......................................... 37,179 10,922 7,250
(2) Amounts include stock-based expenses, as follows:
Fiscal Year Ended January 31,
2014 2013 2012
Cost of revenues ............................................. $ 45,608 $ 33,757 $ 17,451
Research and development ..................................... 107,420 76,333 45,894
Marketing and sales .......................................... 258,571 199,284 115,730
General and administrative ..................................... 91,681 69,976 50,183
(3) Prior period results have been adjusted to reflect the four-for-one stock split through a stock dividend which occurred in
April 2013.
See accompanying Notes.
65