Salesforce.com 2014 Annual Report Download - page 110
Download and view the complete annual report
Please find page 110 of the 2014 Salesforce.com annual report below. You can navigate through the pages in the report by either clicking on the pages listed below, or by using the keyword search tool below to find specific information within the annual report.-
 1
1 -
2
-
3
-
4
-
5
-
6
-
7
-
8
-
9
-
10
-
11
-
12
-
13
-
14
-
15
-
16
-
17
-
18
-
19
-
20
-
21
-
22
-
23
-
24
-
25
-
26
-
27
-
28
-
29
-
30
-
31
-
32
-
33
-
34
-
35
-
36
-
37
-
38
-
39
-
40
-
41
-
42
-
43
-
44
-
45
-
46
-
47
-
48
-
49
-
50
-
51
-
52
-
53
-
54
-
55
-
56
-
57
-
58
-
59
-
60
-
61
-
62
-
63
-
64
-
65
-
66
-
67
-
68
-
69
-
70
-
71
-
72
-
73
-
74
-
75
-
76
-
77
-
78
-
79
-
80
-
81
-
82
-
83
-
84
-
85
-
86
-
87
-
88
-
89
-
90
-
91
-
92
-
93
-
94
-
95
-
96
-
97
-
98
-
99
-
 100
100 -
 101
101 -
 102
102 -
 103
103 -
 104
104 -
 105
105 -
 106
106 -
 107
107 -
 108
108 -
 109
109 -
 110
110 -
 111
111 -
 112
112 -
 113
113 -
 114
114 -
 115
115 -
 116
116 -
 117
117 -
 118
118 -
 119
119 -
 120
120 -
121
-
122
-
123
-
124
-
125
-
126
-
127
-
128
 |
 |

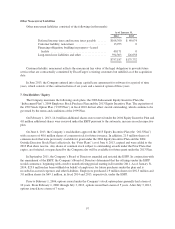
14. Subsequent Events
The Company evaluated subsequent events through the date this Annual Report on Form 10-K was filed
with the SEC.
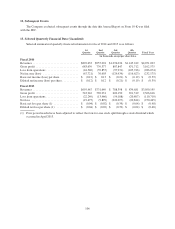
15. Selected Quarterly Financial Data (Unaudited)
Selected summarized quarterly financial information for fiscal 2014 and 2013 is as follows:
1st
Quarter
2nd
Quarter
3rd
Quarter
4th
Quarter Fiscal Year
(in thousands, except per share data)
Fiscal 2014
Revenues ............................... $892,633 $957,094 $1,076,034 $1,145,242 $4,071,003
Gross profit ............................. 683,639 739,377 807,847 871,712 3,102,575
Loss from operations ...................... (44,540) (39,857) (97,931) (103,746) (286,074)
Net income (loss) ........................ (67,721) 76,603 (124,434) (116,623) (232,175)
Basic net income (loss) per share ............ $ (0.12) $ 0.13 $ (0.21) $ (0.19) $ (0.39)
Diluted net income (loss) per share ........... $ (0.12) $ 0.12 $ (0.21) $ (0.19) $ (0.39)
Fiscal 2013
Revenues ............................... $695,467 $731,649 $ 788,398 $ 834,681 $3,050,195
Gross profit ............................. 543,916 569,231 602,150 651,319 2,366,616
Loss from operations ...................... (22,249) (13,466) (54,188) (20,807) (110,710)
Net loss ................................ (19,475) (9,829) (220,297) (20,844) (270,445)
Basic net loss per share (1) ................. $ (0.04) $ (0.02) $ (0.39) $ (0.04) $ (0.48)
Diluted net loss per share (1) ............... $ (0.04) $ (0.02) $ (0.39) $ (0.04) $ (0.48)
(1) Prior period results have been adjusted to reflect the four-for-one stock split through a stock dividend which
occurred in April 2013.
106