Salesforce.com 2014 Annual Report Download - page 71
Download and view the complete annual report
Please find page 71 of the 2014 Salesforce.com annual report below. You can navigate through the pages in the report by either clicking on the pages listed below, or by using the keyword search tool below to find specific information within the annual report.-
 1
1 -
2
-
3
-
4
-
5
-
6
-
7
-
8
-
9
-
10
-
11
-
12
-
13
-
14
-
15
-
16
-
17
-
18
-
19
-
20
-
21
-
22
-
23
-
24
-
25
-
26
-
27
-
28
-
29
-
30
-
31
-
32
-
33
-
34
-
35
-
36
-
37
-
38
-
39
-
40
-
41
-
42
-
43
-
44
-
45
-
46
-
47
-
48
-
49
-
50
-
51
-
52
-
53
-
54
-
55
-
56
-
57
-
58
-
59
-
60
-
 61
61 -
 62
62 -
 63
63 -
 64
64 -
 65
65 -
 66
66 -
 67
67 -
 68
68 -
 69
69 -
 70
70 -
 71
71 -
 72
72 -
 73
73 -
 74
74 -
 75
75 -
 76
76 -
 77
77 -
 78
78 -
 79
79 -
 80
80 -
 81
81 -
82
-
83
-
84
-
85
-
86
-
87
-
88
-
89
-
90
-
91
-
92
-
93
-
94
-
95
-
96
-
97
-
98
-
99
-
100
-
101
-
102
-
103
-
104
-
105
-
106
-
107
-
108
-
109
-
110
-
111
-
112
-
113
-
114
-
115
-
116
-
117
-
118
-
119
-
120
-
121
-
122
-
123
-
124
-
125
-
126
-
127
-
128
 |
 |

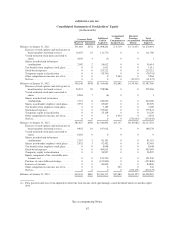
salesforce.com, inc.
Consolidated Statements of Stockholders’ Equity
(in thousands)
Common Stock Additional
Paid-in
Capital(1)
Accumulated
Other
Comprehensive
Income/(Loss)
Retained
Earnings
(Accumulated
Deficit)
Total
Stockholders’
Equity(1)Shares(1) Amount(1)
Balances at January 31, 2011 .................. 531,684 $532 $1,098,205 $ 6,719 $ 171,035 $1,276,491
Exercise of stock options and stock grants to
board members for board services ........ 10,070 10 111,770 0 0 111,780
Vested restricted stock units converted to
shares .............................. 4,300 4 (3) 0 0 1
Shares issued related to business
combinations ........................ 2,092 2 56,612 0 0 56,614
Tax benefits from employee stock plans ..... 0 0 1,611 0 0 1,611
Stock-based expenses .................... 0 0 225,212 0 0 225,212
Temporary equity reclassification .......... 0 0 (78,741) 0 0 (78,741)
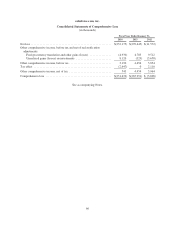
Other comprehensive income, net of tax ..... 0 0 0 5,964 0 5,964
Net loss ............................... 0 0 0 0 (11,572) (11,572)
Balances at January 31, 2012 .................. 548,146 $548 $1,414,666 $12,683 $ 159,463 $1,587,360
Exercise of stock options and stock grants to
board members for board services ........ 20,237 20 278,986 0 0 279,006
Vested restricted stock units converted to
shares .............................. 6,564 7 (6) 0 0 1
Shares issued related to business
combinations ........................ 7,727 8 240,020 0 0 240,028
Shares issued under employee stock plans .... 2,953 3 69,067 0 0 69,070
Tax benefits from employee stock plans ..... 0 0 7,189 0 0 7,189
Stock-based expenses .................... 0 0 375,841 0 0 375,841
Temporary equity reclassification .......... 0 0 25,129 0 0 25,129
Other comprehensive income, net of tax ..... 0 0 0 4,454 0 4,454
Net loss ............................... 0 0 0 0 (270,445) (270,445)
Balances at January 31, 2013 .................. 585,627 $586 $2,410,892 $17,137 $(110,982) $2,317,633
Exercise of stock options and stock grants to
board members for board services ........ 9,952 10 197,012 0 0 196,578
Vested restricted stock units converted to
shares .............................. 9,265 9 0 0 0 9
Shares issued related to business
combinations ........................ 2,367 2 81,191 0 0 81,193
Shares issued under employee stock plans .... 2,932 3 92,482 0 0 92,485
Tax benefits from employee stock plans ..... 0 0 8,048 0 0 8,048
Stock-based expenses .................... 0 0 494,615 0 0 495,059
Temporary equity reclassification .......... 0 0 26,907 0 0 26,907
Equity component of the convertible notes
issuance, net ......................... 0 0 121,230 0 0 121,230
Purchase of convertible note hedges ........ 0 0 (153,800) 0 0 (153,800)
Issuance of warrants ..................... 0 0 84,800 0 0 84,800
Other comprehensive income, net of tax ..... 0 0 0 543 0 543
Net loss ............................... 0 0 0 0 (232,175) (232,175)
Balances at January 31, 2014 .................. 610,143 $610 $3,363,377 $17,680 $(343,157) $3,038,510
(1) Prior period results have been adjusted to reflect the four-for-one stock split through a stock dividend which occurred in April
2013.
See accompanying Notes.
67