Salesforce.com 2014 Annual Report Download - page 81
Download and view the complete annual report
Please find page 81 of the 2014 Salesforce.com annual report below. You can navigate through the pages in the report by either clicking on the pages listed below, or by using the keyword search tool below to find specific information within the annual report.-
 1
1 -
2
-
3
-
4
-
5
-
6
-
7
-
8
-
9
-
10
-
11
-
12
-
13
-
14
-
15
-
16
-
17
-
18
-
19
-
20
-
21
-
22
-
23
-
24
-
25
-
26
-
27
-
28
-
29
-
30
-
31
-
32
-
33
-
34
-
35
-
36
-
37
-
38
-
39
-
40
-
41
-
42
-
43
-
44
-
45
-
46
-
47
-
48
-
49
-
50
-
51
-
52
-
53
-
54
-
55
-
56
-
57
-
58
-
59
-
60
-
61
-
62
-
63
-
64
-
65
-
66
-
67
-
68
-
69
-
70
-
 71
71 -
 72
72 -
 73
73 -
 74
74 -
 75
75 -
 76
76 -
 77
77 -
 78
78 -
 79
79 -
 80
80 -
 81
81 -
 82
82 -
 83
83 -
 84
84 -
 85
85 -
 86
86 -
 87
87 -
 88
88 -
 89
89 -
 90
90 -
 91
91 -
92
-
93
-
94
-
95
-
96
-
97
-
98
-
99
-
100
-
101
-
102
-
103
-
104
-
105
-
106
-
107
-
108
-
109
-
110
-
111
-
112
-
113
-
114
-
115
-
116
-
117
-
118
-
119
-
120
-
121
-
122
-
123
-
124
-
125
-
126
-
127
-
128
 |
 |

Tax Credit Carryforward Exists (ASU 2013-11), which provides guidance on the financial statement presentation
of an unrecognized tax benefit when a net operating loss (“NOL”) carryforward, a similar tax loss, or a tax credit
carryforward exists. ASU 2013-11 supports the approach for companies to present an unrecognized tax benefit as
a reduction of a deferred tax asset for a NOL or tax credit carryforward whenever the NOL or tax credit
carryforward would be available to reduce the additional taxable income or tax due if the tax position is
disallowed. This approach requires companies to assess whether to net the unrecognized tax benefit with a
deferred tax asset as of the reporting date. The Company adopted ASU 2013-11 in fiscal 2014 and the adoption
did not have a material effect on the consolidated financial statements.
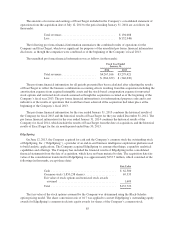
2. Investments
Marketable Securities
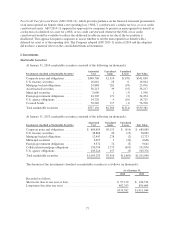
At January 31, 2014, marketable securities consisted of the following (in thousands):
Investments classified as Marketable Securities
Amortized
Cost
Unrealized
Gains
Unrealized
Losses Fair Value
Corporate notes and obligations ............ $340,706 $1,314 $(170) $341,850
U.S. treasury securities ................... 16,016 28 0 16,044
Mortgage backed obligations .............. 24,888 281 (93) 25,076
Asset backed securities ................... 38,213 39 (35) 38,217
Municipal securities ..................... 2,000 1 (3) 1,998
Foreign government obligations ............ 24,305 171 (2) 24,474
U.S. agency obligations .................. 14,726 9 (10) 14,725
Covered bonds .......................... 76,282 717 (1) 76,998
Total marketable securities ................ $537,136 $2,560 $(314) $539,382
At January 31, 2013, marketable securities consisted of the following (in thousands):
Investments classified as Marketable Securities
Amortized
Cost
Unrealized
Gains
Unrealized
Losses Fair Value
Corporate notes and obligations ............ $ 685,695 $5,113 $ (919) $ 689,889
U.S. treasury securities ................... 38,864 20 (15) 38,869
Mortgage backed obligations .............. 12,447 278 (2) 12,723
Municipal securities ..................... 2,697 1 (32) 2,666
Foreign government obligations ............ 9,572 72 (3) 9,641
Collateralized mortgage obligations ......... 150,794 1,775 (693) 151,876
U.S. agency obligations ................... 105,224 157 (5) 105,376
Total marketable securities ................ $1,005,293 $7,416 $(1,669) $1,011,040
The duration of the investments classified as marketable securities is as follows (in thousands):
As of January 31,
2014 2013
Recorded as follows:
Short-term (due in one year or less) ............................. $ 57,139 $ 120,376
Long-term (due after one year) ................................ 482,243 890,664
$539,382 $1,011,040
77