Salesforce.com 2014 Annual Report Download - page 102
Download and view the complete annual report
Please find page 102 of the 2014 Salesforce.com annual report below. You can navigate through the pages in the report by either clicking on the pages listed below, or by using the keyword search tool below to find specific information within the annual report.-
 1
1 -
2
-
3
-
4
-
5
-
6
-
7
-
8
-
9
-
10
-
11
-
12
-
13
-
14
-
15
-
16
-
17
-
18
-
19
-
20
-
21
-
22
-
23
-
24
-
25
-
26
-
27
-
28
-
29
-
30
-
31
-
32
-
33
-
34
-
35
-
36
-
37
-
38
-
39
-
40
-
41
-
42
-
43
-
44
-
45
-
46
-
47
-
48
-
49
-
50
-
51
-
52
-
53
-
54
-
55
-
56
-
57
-
58
-
59
-
60
-
61
-
62
-
63
-
64
-
65
-
66
-
67
-
68
-
69
-
70
-
71
-
72
-
73
-
74
-
75
-
76
-
77
-
78
-
79
-
80
-
81
-
82
-
83
-
84
-
85
-
86
-
87
-
88
-
89
-
90
-
91
-
 92
92 -
 93
93 -
 94
94 -
 95
95 -
 96
96 -
 97
97 -
 98
98 -
 99
99 -
 100
100 -
 101
101 -
 102
102 -
 103
103 -
 104
104 -
 105
105 -
 106
106 -
 107
107 -
 108
108 -
 109
109 -
 110
110 -
 111
111 -
 112
112 -
113
-
114
-
115
-
116
-
117
-
118
-
119
-
120
-
121
-
122
-
123
-
124
-
125
-
126
-
127
-
128
 |
 |

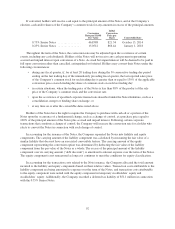
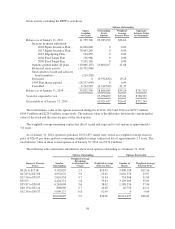
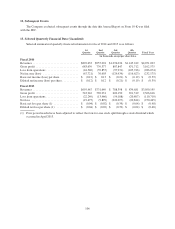
Stock activity excluding the ESPP is as follows:
Options Outstanding
Shares
Available
for Grant
Outstanding
Stock
Options
Weighted-
Average
Exercise Price
Aggregate
Intrinsic Value
(in thousands)
Balance as of January 31, 2013 ....... 11,759,740 29,983,292 $26.60
Increase in shares authorized:
2004 Equity Incentive Plan . . 14,000,000 0 0.00
2013 Equity Incentive Plan . . 76,443,240 0 0.00
2010 EdgeSpring Plan ...... 124,859 0 0.00
2004 ExactTarget Plan ...... 136,986 0 0.00
2008 ExactTarget Plan ...... 3,202,185 0 0.00
Options granted under all plans . . . (10,866,107) 10,866,107 41.08
Restricted stock activity ......... (14,792,960)
Stock grants to board and advisory
board members .............. (210,320)
Exercised .................... 0 (9,932,832) 19.25
1999 Plan shares expired ........ (26,257,609) 0 0.00
Cancelled .................... 2,312,522 (2,312,522) 31.37
Balance as of January 31, 2014 ....... 55,852,536 28,604,045 $34.26 $751,314
Vested or expected to vest ........... 27,258,499 $33.81 $728,393
Exercisable as of January 31, 2014 .... 10,921,637 $26.45 $372,249
The total intrinsic value of the options exercised during fiscal 2014, 2013 and 2012 was $292.3 million,
$506.9 million and $224.9 million, respectively. The intrinsic value is the difference between the current market
value of the stock and the exercise price of the stock option.
The weighted-average remaining contractual life of vested and expected to vest options is approximately
3.8 years.
As of January 31, 2014, options to purchase 10,921,637 shares were vested at a weighted average exercise
price of $26.45 per share and had a remaining weighted-average contractual life of approximately 2.3 years. The
total intrinsic value of these vested options as of January 31, 2014 was $372.2 million.
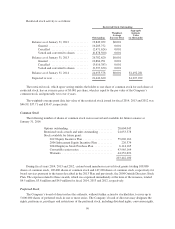
The following table summarizes information about stock options outstanding as of January 31, 2014:
Options Outstanding Options Exercisable
Range of Exercise
Prices
Number
Outstanding
Weighted-Average
Remaining
Contractual Life
(Years)
Weighted-Average
Exercise Price
Number of
Shares
Weighted-Average
Exercise Price
$0.26 to $17.06 ....... 4,142,029 2.3 $10.93 3,400,198 $11.56
$17.83 to $27.06 ...... 4,952,072 3.9 25.61 2,022,376 25.97
$27.56 to $35.07 ...... 2,016,954 3.7 31.54 754,568 31.94
$35.63 .............. 4,424,751 1.8 35.63 3,129,209 35.63
$35.87 to $39.09 ...... 6,261,008 3.6 38.02 1,588,536 37.96
$40.19 to $52.14 ...... 898,060 5.7 42.90 26,750 42.11
$52.30 to $59.37 ...... 5,909,171 6.8 52.49 0 0.00
28,604,045 3.9 $34.26 10,921,637 $26.45
98