Salesforce.com 2014 Annual Report Download - page 61
Download and view the complete annual report
Please find page 61 of the 2014 Salesforce.com annual report below. You can navigate through the pages in the report by either clicking on the pages listed below, or by using the keyword search tool below to find specific information within the annual report.-
 1
1 -
2
-
3
-
4
-
5
-
6
-
7
-
8
-
9
-
10
-
11
-
12
-
13
-
14
-
15
-
16
-
17
-
18
-
19
-
20
-
21
-
22
-
23
-
24
-
25
-
26
-
27
-
28
-
29
-
30
-
31
-
32
-
33
-
34
-
35
-
36
-
37
-
38
-
39
-
40
-
41
-
42
-
43
-
44
-
45
-
46
-
47
-
48
-
49
-
50
-
 51
51 -
 52
52 -
 53
53 -
 54
54 -
 55
55 -
 56
56 -
 57
57 -
 58
58 -
 59
59 -
 60
60 -
 61
61 -
 62
62 -
 63
63 -
 64
64 -
 65
65 -
 66
66 -
 67
67 -
 68
68 -
 69
69 -
 70
70 -
 71
71 -
72
-
73
-
74
-
75
-
76
-
77
-
78
-
79
-
80
-
81
-
82
-
83
-
84
-
85
-
86
-
87
-
88
-
89
-
90
-
91
-
92
-
93
-
94
-
95
-
96
-
97
-
98
-
99
-
100
-
101
-
102
-
103
-
104
-
105
-
106
-
107
-
108
-
109
-
110
-
111
-
112
-
113
-
114
-
115
-
116
-
117
-
118
-
119
-
120
-
121
-
122
-
123
-
124
-
125
-
126
-
127
-
128
 |
 |

operating profit, non-GAAP net income and non-GAAP earnings per share should be considered in addition to,
not as a substitute for, or in isolation from, measures prepared in accordance with GAAP. Additionally, in the
case of stock-based expense, if we did not pay a portion of compensation in the form of stock-based expense, the
cash salary expense included in costs of revenues and operating expenses would be higher which would affect
our cash position.
We compensate for these limitations by reconciling non-GAAP gross profit, non-GAAP operating profit,
non-GAAP net income and non-GAAP earnings per share to the most comparable GAAP financial measure. We
encourage investors and others to review our financial information in its entirety, not to rely on any single
financial measure and to view our non-GAAP financial measures in conjunction with the most comparable
GAAP financial measures.
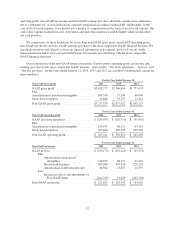
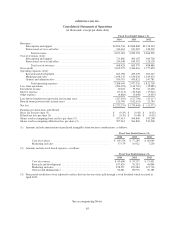
Our reconciliation of the non-GAAP financial measures of gross profit, operating profit, net income and
earnings per share to the most comparable GAAP measure, “gross profit,” “loss from operations,” “net loss” and
“Net loss per share” for the years ended January 31, 2014, 2013 and 2012 are as follows (in thousands, except for
share numbers):
For the Year Ended January 31,
Non-GAAP gross profit 2014 2013 2012
GAAP gross profit ........................ $3,102,575 $2,366,616 $1,777,653
Plus:
Amortization of purchased intangibles ........ 109,356 77,249 60,069
Stock-based expenses ..................... 45,608 33,757 17,451
Non-GAAP gross profit ................... $3,257,539 $2,477,622 $1,855,173
For the Year Ended January 31,
Non-GAAP operating profit 2014 2013 2012
GAAP loss from operations ................ $ (286,074) $ (110,710) $ (35,085)
Plus:
Amortization of purchased intangibles ........ 146,535 88,171 67,319
Stock-based expenses ..................... 503,280 379,350 229,258
Non-GAAP operating profit ................ $ 363,741 $ 356,811 $ 261,492
For the Year Ended January 31,
Non-GAAP net income 2014 2013 2012
GAAP net loss ........................... $ (232,175) $ (270,445) $ (11,572)
Plus:
Amortization of purchased
intangibles .................... 146,535 88,171 67,319
Stock-based expenses ............. 503,280 379,350 229,258
Amortization of debt discount, net . . . 46,942 23,837 12,335
Less:
Income tax effects and adjustments of
Non-GAAP items .............. (242,729) 21,629 (103,730)
Non-GAAP net income .................... $ 221,853 $ 242,542 $ 193,610
57