Salesforce.com 2014 Annual Report Download - page 54
Download and view the complete annual report
Please find page 54 of the 2014 Salesforce.com annual report below. You can navigate through the pages in the report by either clicking on the pages listed below, or by using the keyword search tool below to find specific information within the annual report.-
 1
1 -
2
-
3
-
4
-
5
-
6
-
7
-
8
-
9
-
10
-
11
-
12
-
13
-
14
-
15
-
16
-
17
-
18
-
19
-
20
-
21
-
22
-
23
-
24
-
25
-
26
-
27
-
28
-
29
-
30
-
31
-
32
-
33
-
34
-
35
-
36
-
37
-
38
-
39
-
40
-
41
-
42
-
43
-
 44
44 -
 45
45 -
 46
46 -
 47
47 -
 48
48 -
 49
49 -
 50
50 -
 51
51 -
 52
52 -
 53
53 -
 54
54 -
 55
55 -
 56
56 -
 57
57 -
 58
58 -
 59
59 -
 60
60 -
 61
61 -
 62
62 -
 63
63 -
 64
64 -
65
-
66
-
67
-
68
-
69
-
70
-
71
-
72
-
73
-
74
-
75
-
76
-
77
-
78
-
79
-
80
-
81
-
82
-
83
-
84
-
85
-
86
-
87
-
88
-
89
-
90
-
91
-
92
-
93
-
94
-
95
-
96
-
97
-
98
-
99
-
100
-
101
-
102
-
103
-
104
-
105
-
106
-
107
-
108
-
109
-
110
-
111
-
112
-
113
-
114
-
115
-
116
-
117
-
118
-
119
-
120
-
121
-
122
-
123
-
124
-
125
-
126
-
127
-
128
 |
 |

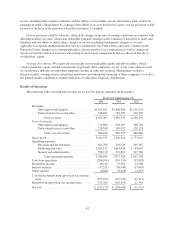
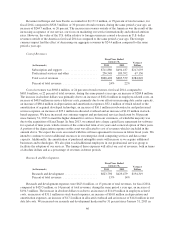
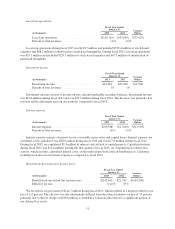
in absolute dollars was primarily due to an increase of $77.5 million in employee-related costs, an increase of
$16.3 million in stock-based expenses, an increase of $36.2 million in service delivery costs, primarily due to our
efforts to increase data center capacity, an increase of $37.5 million in depreciation and amortization expenses,
$17.2 million of which related to the amortization of purchased intangible assets and an increase of $14.6 million
in allocated overhead. We increased customer support and professional services headcount by 32 percent since
January 31, 2012 to meet the higher demand for services from our customers. Some of the increase in headcount
was due to acquired businesses.
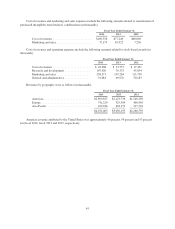
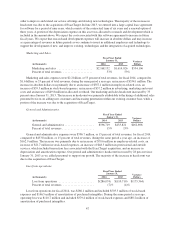
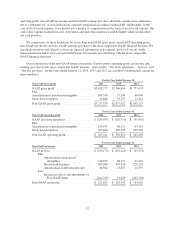
Research and Development.
Fiscal Year Ended
January 31, Variance
Dollars(in thousands) 2013 2012
Research and development .................. $429,479 $295,347 $134,132
Percent of total revenues .................... 14% 13%
Research and development expenses were $429.5 million, or 14 percent of total revenues, during fiscal
2013, compared to $295.3 million, or 13 percent of total revenues, during fiscal 2012, an increase of
$134.1 million. The increase in absolute dollars was primarily due to an increase of $92.6 million in employee-
related costs, an increase of $30.4 million in stock-based expenses and an increase of $8.8 million in our
development and test data center. We increased our research and development headcount by 36 percent since
January 31, 2012 in order to improve and extend our service offerings and develop new technologies. Some of
the increase in headcount was due to acquired businesses.
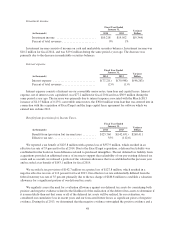
Marketing and Sales.
Fiscal Year Ended
January 31, Variance
Dollars(in thousands) 2013 2012
Marketing and sales ........................ $1,614,026 $1,169,610 $444,416
Percent of total revenues .................... 53% 52%
Marketing and sales expenses were $1.6 billion, or 53 percent of total revenues, for fiscal 2013, compared to
$1.2 billion, or 52 percent of total revenues, during fiscal 2012, an increase of $444.4 million. The increase in
absolute dollars was primarily due to increases of $305.9 million in employee-related costs, including
amortization of deferred commissions, $83.6 million in stock-based expenses, $29.3 million in advertising,
marketing and event costs and $23.7 million in allocated overhead. Our marketing and sales headcount increased
by 25 percent since January 31, 2012 as we hired additional sales personnel to focus on adding new customers
and increasing penetration within our existing customer base. Some of the increase in headcount was due to
acquired businesses.
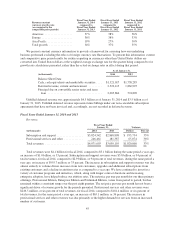
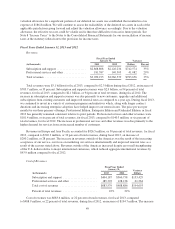
General and Administrative.
Fiscal Year Ended
January 31, Variance
Dollars(in thousands) 2013 2012
General and administrative .................. $433,821 $347,781 $86,040
Percent of total revenues .................... 15% 15%
General and administrative expenses were $433.8 million, or 15 percent of total revenues, during fiscal
2013, compared to $347.8 million, or 15 percent of total revenues, during fiscal 2012, an increase of
$86.0 million. The increase was primarily due to an increase of $56.2 million in employee-related costs and an
increase of $19.8 million in stock-based expenses. Our general and administrative headcount increased by
15 percent since January 31, 2012 as we added personnel to support our growth.
50