Salesforce.com 2013 Annual Report Download - page 97
Download and view the complete annual report
Please find page 97 of the 2013 Salesforce.com annual report below. You can navigate through the pages in the report by either clicking on the pages listed below, or by using the keyword search tool below to find specific information within the annual report.-
 1
1 -
2
-
3
-
4
-
5
-
6
-
7
-
8
-
9
-
10
-
11
-
12
-
13
-
14
-
15
-
16
-
17
-
18
-
19
-
20
-
21
-
22
-
23
-
24
-
25
-
26
-
27
-
28
-
29
-
30
-
31
-
32
-
33
-
34
-
35
-
36
-
37
-
38
-
39
-
40
-
41
-
42
-
43
-
44
-
45
-
46
-
47
-
48
-
49
-
50
-
51
-
52
-
53
-
54
-
55
-
56
-
57
-
58
-
59
-
60
-
61
-
62
-
63
-
64
-
65
-
66
-
67
-
68
-
69
-
70
-
71
-
72
-
73
-
74
-
75
-
76
-
77
-
78
-
79
-
80
-
81
-
82
-
83
-
84
-
85
-
86
-
 87
87 -
 88
88 -
 89
89 -
 90
90 -
 91
91 -
 92
92 -
 93
93 -
 94
94 -
 95
95 -
 96
96 -
 97
97 -
 98
98 -
 99
99 -
 100
100 -
 101
101 -
 102
102 -
 103
103 -
 104
104 -
 105
105 -
 106
106 -
 107
107 -
108
-
109
-
110
-
111
-
112
-
113
-
114
-
115
-
116
-
117
-
118
-
119
-
120
 |
 |

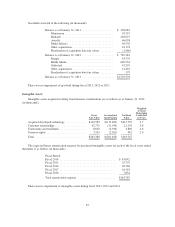
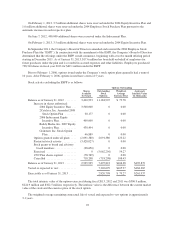
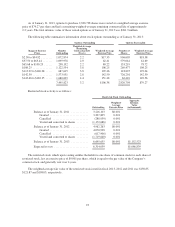
As of January 31, 2013, options to purchase 2,820,798 shares were vested at a weighted average exercise
price of $79.27 per share and had a remaining weighted-average remaining contractual life of approximately
2.2 years. The total intrinsic value of these vested options as of January 31, 2013 was $261.9 million.
The following table summarizes information about stock options outstanding as of January 31, 2013:
Options Outstanding Options Exercisable
Range of Exercise
Prices
Number
Outstanding
Weighted-Average
Remaining
Contractual Life
(Years)
Weighted-Average
Exercise Price
Number of
Shares
Weighted-Average
Exercise Price
$2.30 to $34.92 ........ 1,072,874 2.2 $17.35 906,605 $18.58
$37.50 to $65.44 ....... 1,099,978 2.0 62.41 579,061 61.69
$65.68 to $100.29 ...... 258,152 2.2 80.22 133,219 78.72
$108.25 .............. 1,122,554 3.8 108.25 269,477 108.25
$113.29 to $140.28 ..... 687,615 3.8 129.46 143,825 129.04
$142.50 .............. 1,573,951 2.8 142.50 726,201 142.50
$143.46 to $169.35 ..... 1,680,699 4.4 151.48 62,410 149.56
7,495,823 3.2 $106.38 2,820,798 $79.27
Restricted stock activity is as follows:
Restricted Stock Outstanding
Outstanding
Weighted-
Average
Exercise Price
Aggregate
Intrinsic
Value
(in thousands)
Balance as of January 31, 2011 ............ 3,216,103 $0.001
Granted ........................... 3,207,805 0.001
Cancelled ......................... (288,959) 0.001
Vested and converted to shares ........ (1,172,686) 0.001
Balance as of January 31, 2012 ............ 4,962,263 $0.001
Granted ........................... 4,070,938 0.001
Cancelled ......................... (617,906) 0.001
Vested and converted to shares ........ (1,719,640) 0.001
Balance as of January 31, 2013 ............ 6,695,655 $0.001 $1,152,523
Expected to vest ........................ 6,314,059 $1,086,839
The restricted stock, which upon vesting entitles the holder to one share of common stock for each share of
restricted stock, has an exercise price of $0.001 per share, which is equal to the par value of the Company’s
common stock, and generally vest over 4 years.
The weighted-average fair value of the restricted stock issued in fiscal 2013, 2012 and 2011 was $150.85,
$121.87 and $108.03, respectively.
93