Salesforce.com 2013 Annual Report Download - page 50
Download and view the complete annual report
Please find page 50 of the 2013 Salesforce.com annual report below. You can navigate through the pages in the report by either clicking on the pages listed below, or by using the keyword search tool below to find specific information within the annual report.-
 1
1 -
2
-
3
-
4
-
5
-
6
-
7
-
8
-
9
-
10
-
11
-
12
-
13
-
14
-
15
-
16
-
17
-
18
-
19
-
20
-
21
-
22
-
23
-
24
-
25
-
26
-
27
-
28
-
29
-
30
-
31
-
32
-
33
-
34
-
35
-
36
-
37
-
38
-
39
-
 40
40 -
 41
41 -
 42
42 -
 43
43 -
 44
44 -
 45
45 -
 46
46 -
 47
47 -
 48
48 -
 49
49 -
 50
50 -
 51
51 -
 52
52 -
 53
53 -
 54
54 -
 55
55 -
 56
56 -
 57
57 -
 58
58 -
 59
59 -
 60
60 -
61
-
62
-
63
-
64
-
65
-
66
-
67
-
68
-
69
-
70
-
71
-
72
-
73
-
74
-
75
-
76
-
77
-
78
-
79
-
80
-
81
-
82
-
83
-
84
-
85
-
86
-
87
-
88
-
89
-
90
-
91
-
92
-
93
-
94
-
95
-
96
-
97
-
98
-
99
-
100
-
101
-
102
-
103
-
104
-
105
-
106
-
107
-
108
-
109
-
110
-
111
-
112
-
113
-
114
-
115
-
116
-
117
-
118
-
119
-
120
 |
 |

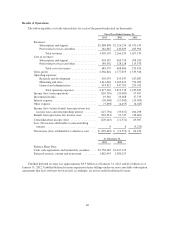
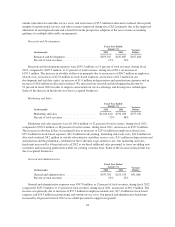
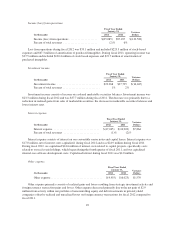
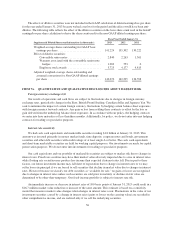
Investment income consists of income on our cash and marketable securities balances. Investment income
was $19.6 million during fiscal 2013 and was $23.3 million during the same period a year ago. The decrease was
primarily due to lower yields and interest rates on our portfolio compared to the same period a year ago.
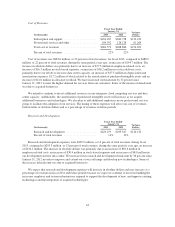
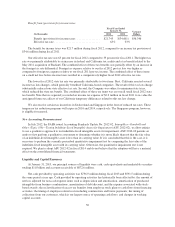
Interest expense.
Fiscal Year Ended
January 31, Variance
Dollars(In thousands) 2013 2012
Interest expense ............................... $(30,948) $(17,045) $(13,903)
Percent of total revenues ........................ (1)% (1)%
Interest expense consists of interest on our convertible senior notes and capital leases. Interest expense, net
of interest costs capitalized, was $30.9 million during fiscal 2013 and was $17.0 million during the same period a
year ago. During fiscal 2013, we capitalized $2.4 million of interest costs related to capital projects. Capitalized
interest during the same period a year ago was $14.6 million. During the first quarter of fiscal 2013, we
suspended pre-construction activity, which includes capitalized interest costs, on the undeveloped real estate in
San Francisco, California resulting in an increase in interest expense as compared to the same period a year ago.
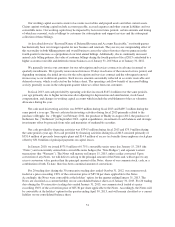
Benefit from (provision for) income taxes.
Fiscal Year Ended
January 31, Variance
Dollars(In thousands) 2013 2012
Benefit from (provision for) income taxes ......... $(142,651) $21,745 $(164,396)
Effective tax rate ............................. (112)% 65%
We recorded a tax provision of $142.7 million during fiscal 2013, which resulted in a negative effective tax
rate of 112 percent. The effective tax rate substantially differed from the federal statutory tax rate of 35 percent
primarily due to the tax charge of $186.8 million to establish a valuation allowance for a significant portion of
our deferred tax assets.
We regularly assess the need for a valuation allowance against our deferred tax assets by considering both
positive and negative evidence related to the likelihood of the realization of the deferred tax assets to determine if
it is more-likely-than-not that some or all of the deferred tax assets will be realized. In our evaluation, we
considered our cumulative loss in recent years and our forecasted future losses as significant pieces of negative
evidence. During fiscal 2013, we determined that the negative evidence outweighed the positive evidence and a
valuation allowance for a significant portion of our deferred tax assets was established that resulted in a tax
expense of $186.8 million. We will continue to assess the realizability of the deferred tax assets in each of the
applicable jurisdictions going forward and adjust the valuation allowance accordingly. Due to the valuation
allowance, the effective tax rate could be volatile and is therefore difficult to forecast in future periods. See
Note 8 “Income Taxes” to the Notes to the Consolidated Financial Statements for our reconciliation of income
taxes at the statutory federal rate to the provision for income taxes.
We recorded a tax benefit of $21.7 million during fiscal 2012, which resulted in an effective tax rate of
65 percent. The effective tax rate was higher than the federal statutory tax rate of 35 percent primarily due to
federal and California tax credits and the impact of the Radian6 acquisition. The combined effect of these tax
benefits was partially offset by foreign tax expense and non-deductible amounts. The effect on the tax rate was
magnified because of the relatively small pre-tax loss.
46