Salesforce.com 2013 Annual Report Download - page 31
Download and view the complete annual report
Please find page 31 of the 2013 Salesforce.com annual report below. You can navigate through the pages in the report by either clicking on the pages listed below, or by using the keyword search tool below to find specific information within the annual report.-
 1
1 -
2
-
3
-
4
-
5
-
6
-
7
-
8
-
9
-
10
-
11
-
12
-
13
-
14
-
15
-
16
-
17
-
18
-
19
-
20
-
 21
21 -
 22
22 -
 23
23 -
 24
24 -
 25
25 -
 26
26 -
 27
27 -
 28
28 -
 29
29 -
 30
30 -
 31
31 -
 32
32 -
 33
33 -
 34
34 -
 35
35 -
 36
36 -
 37
37 -
 38
38 -
 39
39 -
 40
40 -
 41
41 -
42
-
43
-
44
-
45
-
46
-
47
-
48
-
49
-
50
-
51
-
52
-
53
-
54
-
55
-
56
-
57
-
58
-
59
-
60
-
61
-
62
-
63
-
64
-
65
-
66
-
67
-
68
-
69
-
70
-
71
-
72
-
73
-
74
-
75
-
76
-
77
-
78
-
79
-
80
-
81
-
82
-
83
-
84
-
85
-
86
-
87
-
88
-
89
-
90
-
91
-
92
-
93
-
94
-
95
-
96
-
97
-
98
-
99
-
100
-
101
-
102
-
103
-
104
-
105
-
106
-
107
-
108
-
109
-
110
-
111
-
112
-
113
-
114
-
115
-
116
-
117
-
118
-
119
-
120
 |
 |

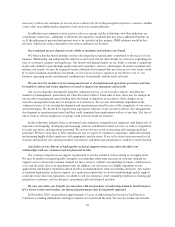
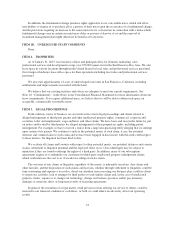
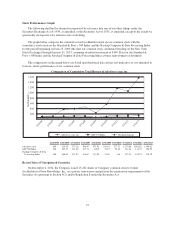
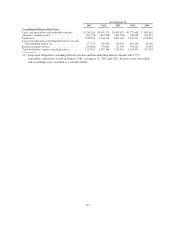
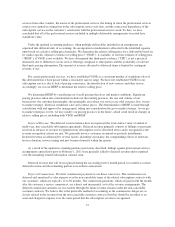
Stock Performance Graph
The following shall not be deemed incorporated by reference into any of our other filings under the
Securities Exchange Act of 1934, as amended, or the Securities Act of 1933, as amended, except to the extent we
specifically incorporate it by reference into such filing.
The graph below compares the cumulative total stockholder return on our common stock with the
cumulative total return on the Standard & Poor’s 500 Index and the Nasdaq Computer & Data Processing Index
for the period beginning on June 23, 2004 (the date our common stock commenced trading on the New York
Stock Exchange) through January 31, 2013, assuming an initial investment of $100. Data for the Standard &
Poor’s 500 Index and the Nasdaq Computer & Data Processing Index assume reinvestment of dividends.
The comparisons in the graph below are based upon historical data and are not indicative of, nor intended to
forecast, future performance of our common stock.
Comparison of Cumulative Total Return of salesforce.com, inc.
-
200
6/23/04
1/31/05
1/31/06
1/31/07
1/31/08
1/31/09
1/31/10
1/31/11
1/31/12
1/31/13
400
600
800
1,000
1,200
1,600
1,400
DOLLARS
salesforce.com, inc. S&P 500 Index Nasdaq Computer
6/23/2004 1/31/2005 1/31/2006 1/31/2007 1/31/2008 1/31/2009 1/31/2010 1/31/2011 1/31/2012 1/31/2013
salesforce.com ........... 100 124.55 373.18 398.45 471.91 241.91 577.73 1,174.00 1,061.82 1,564.82
S&P 500 Index .......... 100 103.25 111.89 125.71 120.5 72.19 93.86 112.42 114.72 130.95
Nasdaq Computer & Data
Processing Index ....... 100 100.45 111.93 116.62 117.84 71.02 116 153.34 162.74 170.19
Recent Sales of Unregistered Securities
On December 4, 2012, the Company issued 15,262 shares of Company common stock to former
stockholders of Prior Knowledge, Inc., in a private transaction exempt from the registration requirements of the
Securities Act pursuant to Section 4(2) and/or Regulation S under the Securities Act.
27