Salesforce.com 2013 Annual Report Download - page 49
Download and view the complete annual report
Please find page 49 of the 2013 Salesforce.com annual report below. You can navigate through the pages in the report by either clicking on the pages listed below, or by using the keyword search tool below to find specific information within the annual report.-
 1
1 -
2
-
3
-
4
-
5
-
6
-
7
-
8
-
9
-
10
-
11
-
12
-
13
-
14
-
15
-
16
-
17
-
18
-
19
-
20
-
21
-
22
-
23
-
24
-
25
-
26
-
27
-
28
-
29
-
30
-
31
-
32
-
33
-
34
-
35
-
36
-
37
-
38
-
 39
39 -
 40
40 -
 41
41 -
 42
42 -
 43
43 -
 44
44 -
 45
45 -
 46
46 -
 47
47 -
 48
48 -
 49
49 -
 50
50 -
 51
51 -
 52
52 -
 53
53 -
 54
54 -
 55
55 -
 56
56 -
 57
57 -
 58
58 -
 59
59 -
60
-
61
-
62
-
63
-
64
-
65
-
66
-
67
-
68
-
69
-
70
-
71
-
72
-
73
-
74
-
75
-
76
-
77
-
78
-
79
-
80
-
81
-
82
-
83
-
84
-
85
-
86
-
87
-
88
-
89
-
90
-
91
-
92
-
93
-
94
-
95
-
96
-
97
-
98
-
99
-
100
-
101
-
102
-
103
-
104
-
105
-
106
-
107
-
108
-
109
-
110
-
111
-
112
-
113
-
114
-
115
-
116
-
117
-
118
-
119
-
120
 |
 |

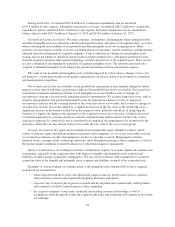
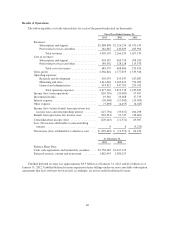
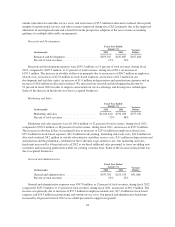
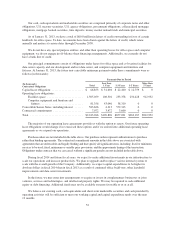
Marketing and Sales.
Fiscal Year Ended
January 31, Variance
Dollars(In thousands) 2013 2012
Marketing and sales ........................ $1,614,026 $1,169,610 $444,416
Percent of total revenues .................... 53% 52%
Marketing and sales expenses were $1.6 billion, or 53 percent of total revenues, for fiscal 2013, compared to
$1.2 billion, or 52 percent of total revenues, during the same period a year ago, an increase of $444.4 million.
The increase in absolute dollars was primarily due to increases of $305.9 million in employee-related costs,
including amortization of deferred commissions, $83.6 million in stock-based expenses, $29.3 million in
advertising, marketing and event costs and $23.7 million in allocated overhead. Our marketing and sales
headcount increased by 25 percent since January 31, 2012 as we hired additional sales personnel to focus on
adding new customers and increasing penetration within our existing customer base. Some of the increase in
headcount was due to acquired businesses.
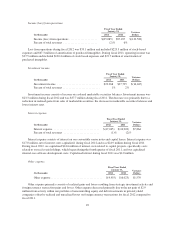
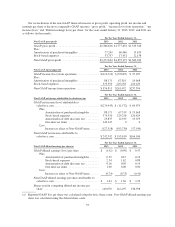
General and Administrative.
Fiscal Year Ended
January 31, Variance
Dollars(In thousands) 2013 2012
General and administrative .................. $433,821 $347,781 $86,040
Percent of total revenues .................... 15% 15%
General and administrative expenses were $433.8 million, or 15 percent of total revenues, during fiscal
2013, compared to $347.8 million, or 15 percent of total revenues, during the same period a year ago, an increase
of $86.0 million. The increase was primarily due to an increase of $56.2 million in employee-related costs and an
increase of $19.8 million in stock-based expenses. Our general and administrative headcount increased by 15
percent since January 31, 2012 as we added personnel to support our growth.
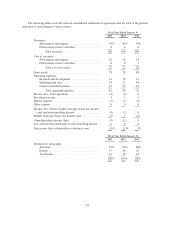
Loss from operations.
Fiscal Year Ended
January 31, Variance
Dollars(In thousands) 2013 2012
Loss from operations ....................... $(110,710) $(35,085) $(75,625)
Percent of total revenues .................... (4)% (2)%
Loss from operations during fiscal 2013 was $110.7 million and included $379.4 million of stock-based
expenses and $88.2 million of amortization of purchased intangibles. During the same period a year ago, loss
from operations was $35.1 million and included $229.3 million of stock-based expenses and $67.3 million of
amortization of purchased intangibles.
Investment income.
Fiscal Year Ended
January 31, Variance
Dollars(In thousands) 2013 2012
Investment income ........................ $19,562 $23,268 $(3,706)
Percent of total revenues .................... 1% 1%
45