Salesforce.com 2013 Annual Report Download - page 78
Download and view the complete annual report
Please find page 78 of the 2013 Salesforce.com annual report below. You can navigate through the pages in the report by either clicking on the pages listed below, or by using the keyword search tool below to find specific information within the annual report.-
 1
1 -
2
-
3
-
4
-
5
-
6
-
7
-
8
-
9
-
10
-
11
-
12
-
13
-
14
-
15
-
16
-
17
-
18
-
19
-
20
-
21
-
22
-
23
-
24
-
25
-
26
-
27
-
28
-
29
-
30
-
31
-
32
-
33
-
34
-
35
-
36
-
37
-
38
-
39
-
40
-
41
-
42
-
43
-
44
-
45
-
46
-
47
-
48
-
49
-
50
-
51
-
52
-
53
-
54
-
55
-
56
-
57
-
58
-
59
-
60
-
61
-
62
-
63
-
64
-
65
-
66
-
67
-
 68
68 -
 69
69 -
 70
70 -
 71
71 -
 72
72 -
 73
73 -
 74
74 -
 75
75 -
 76
76 -
 77
77 -
 78
78 -
 79
79 -
 80
80 -
 81
81 -
 82
82 -
 83
83 -
 84
84 -
 85
85 -
 86
86 -
 87
87 -
 88
88 -
89
-
90
-
91
-
92
-
93
-
94
-
95
-
96
-
97
-
98
-
99
-
100
-
101
-
102
-
103
-
104
-
105
-
106
-
107
-
108
-
109
-
110
-
111
-
112
-
113
-
114
-
115
-
116
-
117
-
118
-
119
-
120
 |
 |

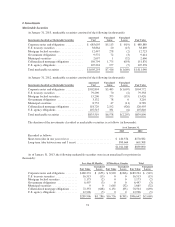
2. Investments
Marketable Securities
At January 31, 2013, marketable securities consisted of the following (in thousands):
Investments classified as Marketable Securities
Amortized
Cost
Unrealized
Gains
Unrealized
Losses Fair Value
Corporate notes and obligations ............ $ 685,695 $5,113 $ (919) $ 689,889
U.S. treasury securities ................... 38,864 20 (15) 38,869
Mortgage backed securities ................ 12,447 278 (2) 12,723
Government obligations .................. 9,572 72 (3) 9,641
Municipal securities ..................... 2,697 1 (32) 2,666
Collateralized mortgage obligations ......... 150,794 1,775 (693) 151,876
U.S. agency obligations ................... 105,224 157 (5) 105,376
Total marketable securities ................ $1,005,293 $7,416 $(1,669) $1,011,040
At January 31, 2012, marketable securities consisted of the following (in thousands):
Investments classified as Marketable Securities
Amortized
Cost
Unrealized
Gains
Unrealized
Losses Fair Value
Corporate notes and obligations ............ $502,894 $3,485 $(1,607) $504,772
U.S. treasury securities ................... 79,290 70 (2) 79,358
Mortgage backed securities ................ 15,206 375 (155) 15,426
Government obligations .................. 3,132 78 0 3,210
Municipal securities ..................... 8,753 47 (11) 8,789
Collateralized mortgage obligations ......... 118,729 2,192 (426) 120,495
U.S. agency obligations ................... 107,515 331 (6) 107,840
Total marketable securities ................ $835,519 $6,578 $(2,207) $839,890
The duration of the investments classified as marketable securities is as follows (in thousands):
As of January 31,
2013 2012
Recorded as follows:
Short-term (due in one year or less) ............................. $ 120,376 $170,582
Long-term (due between one and 3 years) ........................ 890,664 669,308
$1,011,040 $839,890
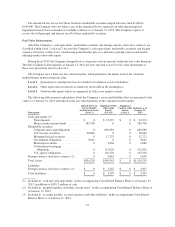
As of January 31, 2013, the following marketable securities were in an unrealized loss position (in
thousands):
Less than 12 Months 12 Months or Greater Total
Fair Value
Unrealized
Losses Fair Value
Unrealized
Losses Fair Value
Unrealized
Losses
Corporate notes and obligations ........ $180,374 $ (653) $ 8,920 $(266) $189,294 $ (919)
U.S. treasury securities ............... 16,513 (15) 0 0 16,513 (15)
Mortgage backed securities ............ 1,173 (2) 0 0 1,173 (2)
Government obligations .............. 6,497 (3) 0 0 6,497 (3)
Municipal securities ................. 0 0 1,665 (32) 1,665 (32)
Collateralized mortgage obligations ..... 72,353 (608) 6,151 (85) 78,504 (693)
U.S. agency obligations ............... 12,996 (5) 0 0 12,996 (5)
$289,906 $(1,286) $16,736 $(383) $306,642 $(1,669)
74