Salesforce.com 2013 Annual Report Download - page 44
Download and view the complete annual report
Please find page 44 of the 2013 Salesforce.com annual report below. You can navigate through the pages in the report by either clicking on the pages listed below, or by using the keyword search tool below to find specific information within the annual report.-
 1
1 -
2
-
3
-
4
-
5
-
6
-
7
-
8
-
9
-
10
-
11
-
12
-
13
-
14
-
15
-
16
-
17
-
18
-
19
-
20
-
21
-
22
-
23
-
24
-
25
-
26
-
27
-
28
-
29
-
30
-
31
-
32
-
33
-
 34
34 -
 35
35 -
 36
36 -
 37
37 -
 38
38 -
 39
39 -
 40
40 -
 41
41 -
 42
42 -
 43
43 -
 44
44 -
 45
45 -
 46
46 -
 47
47 -
 48
48 -
 49
49 -
 50
50 -
 51
51 -
 52
52 -
 53
53 -
 54
54 -
55
-
56
-
57
-
58
-
59
-
60
-
61
-
62
-
63
-
64
-
65
-
66
-
67
-
68
-
69
-
70
-
71
-
72
-
73
-
74
-
75
-
76
-
77
-
78
-
79
-
80
-
81
-
82
-
83
-
84
-
85
-
86
-
87
-
88
-
89
-
90
-
91
-
92
-
93
-
94
-
95
-
96
-
97
-
98
-
99
-
100
-
101
-
102
-
103
-
104
-
105
-
106
-
107
-
108
-
109
-
110
-
111
-
112
-
113
-
114
-
115
-
116
-
117
-
118
-
119
-
120
 |
 |

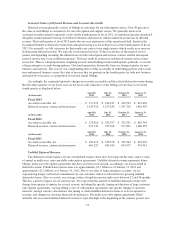
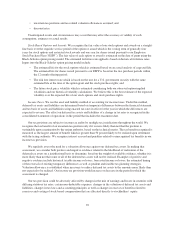
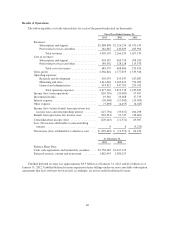
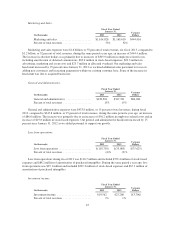
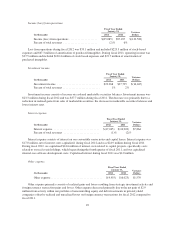
Results of Operations
The following tables set forth selected data for each of the periods indicated (in thousands):
Fiscal Year Ended January 31,
2013 2012 2011
Revenues:
Subscription and support ................... $2,868,808 $2,126,234 $1,551,145
Professional services and other .............. 181,387 140,305 105,994
Total revenues ....................... 3,050,195 2,266,539 1,657,139
Cost of revenues:
Subscription and support ................... 494,187 360,758 208,243
Professional services and other .............. 189,392 128,128 115,570
Total cost of revenues ................. 683,579 488,886 323,813
Gross profit ................................. 2,366,616 1,777,653 1,333,326
Operating expenses:
Research and development ................. 429,479 295,347 187,887
Marketing and sales ....................... 1,614,026 1,169,610 792,029
General and administrative ................. 433,821 347,781 255,913
Total operating expenses ............... 2,477,326 1,812,738 1,235,829
Income (loss) from operations ................... (110,710) (35,085) 97,497
Investment income ............................ 19,562 23,268 37,735
Interest expense .............................. (30,948) (17,045) (24,909)
Other expense ............................... (5,698) (4,455) (6,025)
Income (loss) before benefit from (provision for)
income taxes and noncontrolling interest ........ (127,794) (33,317) 104,298
Benefit from (provision for) income taxes ......... (142,651) 21,745 (34,601)
Consolidated net income (loss) .................. (270,445) (11,572) 69,697
Less: Net income attributable to noncontrolling
interest ................................... 0 0 (5,223)
Net income (loss) attributable to salesforce.com .... $ (270,445) $ (11,572) $ 64,474
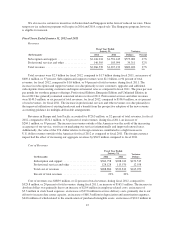
As of January 31,
2013 2012
Balance Sheet Data:
Cash, cash equivalents and marketable securities .... $1,758,285 $1,447,174
Deferred revenue, current and noncurrent .......... 1,862,995 1,380,295
Unbilled deferred revenue was approximately $3.5 billion as of January 31, 2013 and $2.2 billion as of
January 31, 2012. Unbilled deferred revenue represents future billings under our non-cancelable subscription
agreements that have not been invoiced and, accordingly, are not recorded in deferred revenue.
40