Salesforce.com 2013 Annual Report Download - page 48
Download and view the complete annual report
Please find page 48 of the 2013 Salesforce.com annual report below. You can navigate through the pages in the report by either clicking on the pages listed below, or by using the keyword search tool below to find specific information within the annual report.-
 1
1 -
2
-
3
-
4
-
5
-
6
-
7
-
8
-
9
-
10
-
11
-
12
-
13
-
14
-
15
-
16
-
17
-
18
-
19
-
20
-
21
-
22
-
23
-
24
-
25
-
26
-
27
-
28
-
29
-
30
-
31
-
32
-
33
-
34
-
35
-
36
-
37
-
 38
38 -
 39
39 -
 40
40 -
 41
41 -
 42
42 -
 43
43 -
 44
44 -
 45
45 -
 46
46 -
 47
47 -
 48
48 -
 49
49 -
 50
50 -
 51
51 -
 52
52 -
 53
53 -
 54
54 -
 55
55 -
 56
56 -
 57
57 -
 58
58 -
59
-
60
-
61
-
62
-
63
-
64
-
65
-
66
-
67
-
68
-
69
-
70
-
71
-
72
-
73
-
74
-
75
-
76
-
77
-
78
-
79
-
80
-
81
-
82
-
83
-
84
-
85
-
86
-
87
-
88
-
89
-
90
-
91
-
92
-
93
-
94
-
95
-
96
-
97
-
98
-
99
-
100
-
101
-
102
-
103
-
104
-
105
-
106
-
107
-
108
-
109
-
110
-
111
-
112
-
113
-
114
-
115
-
116
-
117
-
118
-
119
-
120
 |
 |

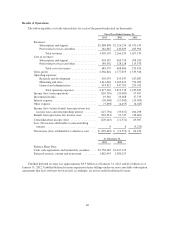
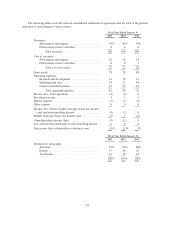
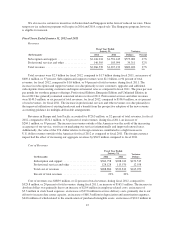
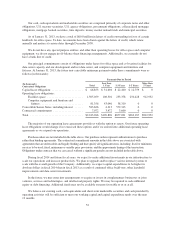
Cost of Revenues.
Fiscal Year Ended
January 31, Variance
Dollars(In thousands) 2013 2012
Subscription and support ....................... $494,187 $360,758 $133,429
Professional services and other .................. 189,392 128,128 61,264
Total cost of revenues ......................... $683,579 $488,886 $194,693
Percent of total revenues ....................... 22% 22%
Cost of revenues was $683.6 million, or 22 percent of total revenues, for fiscal 2013, compared to $488.9
million, or 22 percent of total revenues, during the same period a year ago, an increase of $194.7 million. The
increase in absolute dollars was primarily due to an increase of $77.5 million in employee-related costs, an
increase of $16.3 million in stock-based expenses, an increase of $36.2 million in service delivery costs,
primarily due to our efforts to increase data center capacity, an increase of $37.5 million in depreciation and
amortization expenses, $17.2 million of which related to the amortization of purchased intangible assets and an
increase of $14.6 million in allocated overhead. We have increased our headcount by 32 percent since
January 31, 2012 to meet the higher demand for services from our customers. Some of the increase in headcount
was due to acquired businesses.
We intend to continue to invest additional resources in our enterprise cloud computing services and data
center capacity. Additionally, the amortization of purchased intangible assets will increase as we acquire
additional businesses and technologies. We also plan to add additional employees in our professional services
group to facilitate the adoption of our services. The timing of these expenses will affect our cost of revenues,
both in terms of absolute dollars and as a percentage of revenues in future periods.
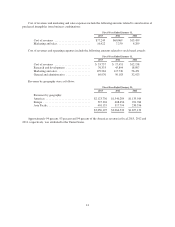
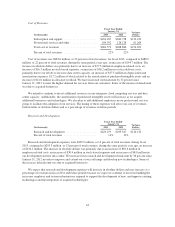
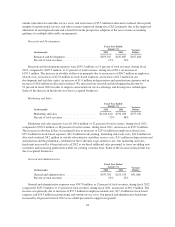
Research and Development.
Fiscal Year Ended
January 31, Variance
Dollars(In thousands) 2013 2012
Research and development ...................... $429,479 $295,347 $134,132
Percent of total revenues ....................... 14% 13%
Research and development expenses were $429.5 million, or 14 percent of total revenues, during fiscal
2013, compared to $295.3 million, or 13 percent of total revenues, during the same period a year ago, an increase
of $134.1 million. The increase in absolute dollars was primarily due to an increase of $92.6 million in
employee-related costs, an increase of $30.4 million in stock-based expenses and an increase of $8.8 million in
our development and test data center. We increased our research and development headcount by 36 percent since
January 31, 2012 in order to improve and extend our service offerings and develop new technologies. Some of
the increase in headcount was due to acquired businesses.
We expect that research and development expenses will increase in absolute dollars and may increase as a
percentage of revenues in fiscal 2014 and future periods because we expect to continue to invest in building the
necessary employee and system infrastructure required to support the development of new, and improve existing,
technologies and the integration of acquired technologies.
44