Salesforce.com 2013 Annual Report Download - page 45
Download and view the complete annual report
Please find page 45 of the 2013 Salesforce.com annual report below. You can navigate through the pages in the report by either clicking on the pages listed below, or by using the keyword search tool below to find specific information within the annual report.-
 1
1 -
2
-
3
-
4
-
5
-
6
-
7
-
8
-
9
-
10
-
11
-
12
-
13
-
14
-
15
-
16
-
17
-
18
-
19
-
20
-
21
-
22
-
23
-
24
-
25
-
26
-
27
-
28
-
29
-
30
-
31
-
32
-
33
-
34
-
 35
35 -
 36
36 -
 37
37 -
 38
38 -
 39
39 -
 40
40 -
 41
41 -
 42
42 -
 43
43 -
 44
44 -
 45
45 -
 46
46 -
 47
47 -
 48
48 -
 49
49 -
 50
50 -
 51
51 -
 52
52 -
 53
53 -
 54
54 -
 55
55 -
56
-
57
-
58
-
59
-
60
-
61
-
62
-
63
-
64
-
65
-
66
-
67
-
68
-
69
-
70
-
71
-
72
-
73
-
74
-
75
-
76
-
77
-
78
-
79
-
80
-
81
-
82
-
83
-
84
-
85
-
86
-
87
-
88
-
89
-
90
-
91
-
92
-
93
-
94
-
95
-
96
-
97
-
98
-
99
-
100
-
101
-
102
-
103
-
104
-
105
-
106
-
107
-
108
-
109
-
110
-
111
-
112
-
113
-
114
-
115
-
116
-
117
-
118
-
119
-
120
 |
 |

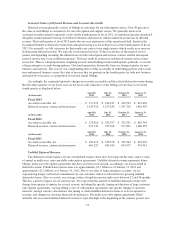
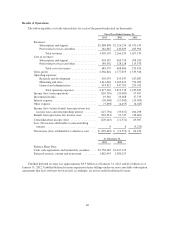
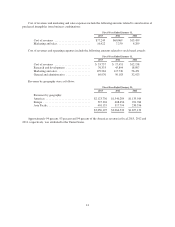
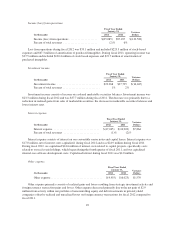
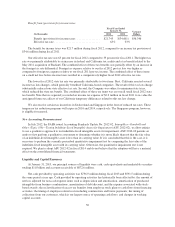
Cost of revenues and marketing and sales expenses include the following amounts related to amortization of
purchased intangibles from business combinations:
Fiscal Year Ended January 31,
2013 2012 2011
Cost of revenues ......................... $77,249 $60,069 $15,459
Marketing and sales ....................... 10,922 7,250 4,209
Cost of revenues and operating expenses include the following amounts related to stock-based awards:
Fiscal Year Ended January 31,
2013 2012 2011
Cost of revenues ......................... $ 33,757 $ 17,451 $12,158
Research and development ................. 76,333 45,894 18,897
Marketing and sales ....................... 199,284 115,730 56,451
General and administrative ................. 69,976 50,183 32,923
Revenues by geography were as follows:
Fiscal Year Ended January 31,
2013 2012 2011
Revenues by geography:
Americas ............................... $2,123,736 $1,540,289 $1,135,019
Europe ................................. 525,304 408,456 291,784
Asia Pacific ............................. 401,155 317,794 230,336
$3,050,195 $2,266,539 $1,657,139
Approximately 94 percent, 93 percent and 94 percent of the Americas revenue in fiscal 2013, 2012 and
2011, respectively, was attributed to the United States.
41