Salesforce.com 2013 Annual Report Download - page 71
Download and view the complete annual report
Please find page 71 of the 2013 Salesforce.com annual report below. You can navigate through the pages in the report by either clicking on the pages listed below, or by using the keyword search tool below to find specific information within the annual report.-
 1
1 -
2
-
3
-
4
-
5
-
6
-
7
-
8
-
9
-
10
-
11
-
12
-
13
-
14
-
15
-
16
-
17
-
18
-
19
-
20
-
21
-
22
-
23
-
24
-
25
-
26
-
27
-
28
-
29
-
30
-
31
-
32
-
33
-
34
-
35
-
36
-
37
-
38
-
39
-
40
-
41
-
42
-
43
-
44
-
45
-
46
-
47
-
48
-
49
-
50
-
51
-
52
-
53
-
54
-
55
-
56
-
57
-
58
-
59
-
60
-
 61
61 -
 62
62 -
 63
63 -
 64
64 -
 65
65 -
 66
66 -
 67
67 -
 68
68 -
 69
69 -
 70
70 -
 71
71 -
 72
72 -
 73
73 -
 74
74 -
 75
75 -
 76
76 -
 77
77 -
 78
78 -
 79
79 -
 80
80 -
 81
81 -
82
-
83
-
84
-
85
-
86
-
87
-
88
-
89
-
90
-
91
-
92
-
93
-
94
-
95
-
96
-
97
-
98
-
99
-
100
-
101
-
102
-
103
-
104
-
105
-
106
-
107
-
108
-
109
-
110
-
111
-
112
-
113
-
114
-
115
-
116
-
117
-
118
-
119
-
120
 |
 |

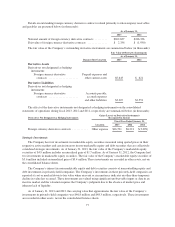
Concentrations of Credit Risk and Significant Customers
The Company’s financial instruments that are exposed to concentrations of credit risk consist primarily of
cash and cash equivalents, marketable securities and trade accounts receivable. Although the Company deposits
its cash with multiple financial institutions, its deposits, at times, may exceed federally insured limits. Collateral
is not required for accounts receivable. The Company maintains an allowance for doubtful accounts receivable
balances. The allowance is based upon historical loss patterns, the number of days that billings are past due and
an evaluation of the potential risk of loss associated with delinquent accounts.
No customer accounted for more than five percent of accounts receivable at January 31, 2013 and one
customer accounted for six percent of accounts receivable at January 31, 2012. No single customer accounted for
five percent or more of total revenue during fiscal 2013, 2012 and 2011.
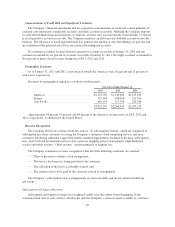
Geographic Locations
As of January 31, 2013 and 2012, assets located outside the Americas were 16 percent and 13 percent of
total assets, respectively.
Revenues by geographical region are as follows (in thousands):
Fiscal Year Ended January 31,
2013 2012 2011
Americas ............................... $2,123,736 $1,540,289 $1,135,019
Europe ................................. 525,304 408,456 291,784
Asia Pacific ............................. 401,155 317,794 230,336
$3,050,195 $2,266,539 $1,657,139
Approximately 94 percent, 93 percent and 94 percent of the Americas revenue in fiscal 2013, 2012 and
2011, respectively, is attributed to the United States.
Revenue Recognition
The Company derives its revenues from two sources: (1) subscription revenues, which are comprised of
subscription fees from customers accessing the Company’s enterprise cloud computing services and from
customers purchasing additional support beyond the standard support that is included in the basic subscription
fees; and (2) related professional services such as process mapping, project management, implementation
services and other revenue. “Other revenue” consists primarily of training fees.
The Company commences revenue recognition when all of the following conditions are satisfied:
• There is persuasive evidence of an arrangement;
• The service has been or is being provided to the customer;
• The collection of the fees is reasonably assured; and
• The amount of fees to be paid by the customer is fixed or determinable.
The Company’s subscription service arrangements are non-cancelable and do not contain refund-type
provisions.
Subscription and Support Revenues
Subscription and support revenues are recognized ratably over the contract terms beginning on the
commencement date of each contract, which is the date the Company’s service is made available to customers.
67