Salesforce.com 2013 Annual Report Download - page 51
Download and view the complete annual report
Please find page 51 of the 2013 Salesforce.com annual report below. You can navigate through the pages in the report by either clicking on the pages listed below, or by using the keyword search tool below to find specific information within the annual report.-
 1
1 -
2
-
3
-
4
-
5
-
6
-
7
-
8
-
9
-
10
-
11
-
12
-
13
-
14
-
15
-
16
-
17
-
18
-
19
-
20
-
21
-
22
-
23
-
24
-
25
-
26
-
27
-
28
-
29
-
30
-
31
-
32
-
33
-
34
-
35
-
36
-
37
-
38
-
39
-
40
-
 41
41 -
 42
42 -
 43
43 -
 44
44 -
 45
45 -
 46
46 -
 47
47 -
 48
48 -
 49
49 -
 50
50 -
 51
51 -
 52
52 -
 53
53 -
 54
54 -
 55
55 -
 56
56 -
 57
57 -
 58
58 -
 59
59 -
 60
60 -
 61
61 -
62
-
63
-
64
-
65
-
66
-
67
-
68
-
69
-
70
-
71
-
72
-
73
-
74
-
75
-
76
-
77
-
78
-
79
-
80
-
81
-
82
-
83
-
84
-
85
-
86
-
87
-
88
-
89
-
90
-
91
-
92
-
93
-
94
-
95
-
96
-
97
-
98
-
99
-
100
-
101
-
102
-
103
-
104
-
105
-
106
-
107
-
108
-
109
-
110
-
111
-
112
-
113
-
114
-
115
-
116
-
117
-
118
-
119
-
120
 |
 |

We also receive certain tax incentives in Switzerland and Singapore in the form of reduced tax rates. These
temporary tax reduction programs will expire in 2016 and 2014, respectively. The Singapore program, however,
is eligible for renewal.
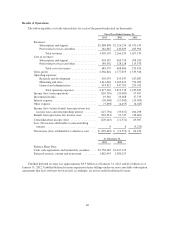
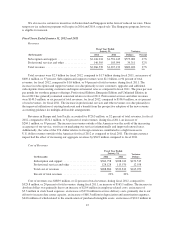
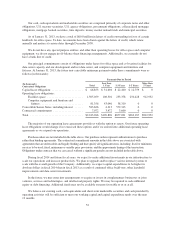
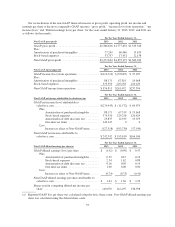
Fiscal Years Ended January 31, 2012 and 2011
Revenues.
Fiscal Year Ended
January 31, Variance
(In thousands) 2012 2011 Dollars Percent
Subscription and support .................... $2,126,234 $1,551,145 $575,089 37%
Professional services and other ............... 140,305 105,994 34,311 32%
Total revenues ............................ $2,266,539 $1,657,139 $609,400 37%
Total revenues were $2.3 billion for fiscal 2012, compared to $1.7 billion during fiscal 2011, an increase of
$609.4 million, or 37 percent. Subscription and support revenues were $2.1 billion, or 94 percent of total
revenues, for fiscal 2012, compared to $1.6 billion, or 94 percent of total revenues, during fiscal 2011. The
increase in subscription and support revenues was due primarily to new customers, upgrades and additional
subscriptions from existing customers and improved renewal rates as compared to fiscal 2011. The price per user
per month for our three primary offerings, Professional Edition, Enterprise Edition and Unlimited Edition, in
fiscal 2012 has generally remained consistent relative to fiscal 2011. Professional services and other revenues
were $140.3 million, or six percent of total revenues, for fiscal 2012, compared to $106.0 million, or six percent
of total revenues, for fiscal 2011. The increase in professional services and other revenues was due primarily to
the improved utilization of existing headcount and a benefit from the prospective adoption of the new revenue
accounting guidance for multiple-deliverable arrangements.
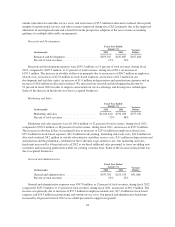
Revenues in Europe and Asia Pacific accounted for $726.3 million, or 32 percent of total revenues, for fiscal
2012, compared to $522.1 million, or 32 percent of total revenues, during fiscal 2011, an increase of
$204.1 million, or 39 percent. The increase in revenues outside of the Americas was the result of the increasing
acceptance of our service, our focus on marketing our services internationally and improved renewal rates.
Additionally, the value of the U.S. dollar relative to foreign currencies contributed to a slight increase in
U.S. dollar revenues outside of the Americas for fiscal 2012 as compared to fiscal 2011. The foreign currency
impact had the effect of increasing our aggregate revenues by $36.9 million compared to fiscal 2011.
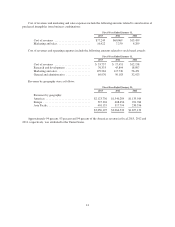
Cost of Revenues.
Fiscal Year Ended
January 31, Variance
Dollars(In thousands) 2012 2011
Subscription and support ....................... $360,758 $208,243 $152,515
Professional services and other .................. 128,128 115,570 12,558
Total cost of revenues ......................... $488,886 $323,813 $165,073
Percent of total revenues ....................... 22% 20%
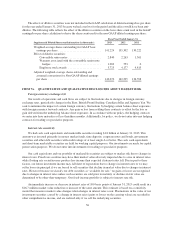
Cost of revenues was $488.9 million, or 22 percent of total revenues, during fiscal 2012, compared to
$323.8 million, or 20 percent of total revenues, during fiscal 2011, an increase of $165.1 million. The increase in
absolute dollars was primarily due to an increase of $20.4 million in employee-related costs, an increase of
$5.3 million in stock based expenses, an increase of $39.8 million in service delivery costs, primarily due to our
efforts to increase data center capacity, an increase of $68.3 million in depreciation and amortization expenses,
$44.6 million of which related to the amortization of purchased intangible assets, an increase of $24.2 million in
47