Public Storage 2001 Annual Report Download - page 9
Download and view the complete annual report
Please find page 9 of the 2001 Public Storage annual report below. You can navigate through the pages in the report by either clicking on the pages listed below, or by using the keyword search tool below to find specific information within the annual report.-
 1
1 -
 2
2 -
 3
3 -
 4
4 -
 5
5 -
 6
6 -
 7
7 -
 8
8 -
 9
9 -
 10
10 -
 11
11 -
 12
12 -
 13
13 -
 14
14 -
 15
15 -
 16
16 -
 17
17 -
 18
18 -
 19
19 -
 20
20 -
21
-
22
-
23
-
24
-
25
-
26
-
27
-
28
-
29
-
30
-
31
-
32
-
33
-
34
-
35
-
36
-
37
-
38
-
39
-
40
-
41
-
42
-
43
-
44
-
45
-
46
-
47
-
48
-
49
-
50
-
51
-
52
-
53
-
54
-
55
-
56
-
57
-
58
-
59
-
60
-
61
-
62
-
63
-
64
-
65
-
66
 |
 |
7
P
UBLIC
S
TORAGE
,I
NC
. 2001 A
NNUAL
R
EPORT
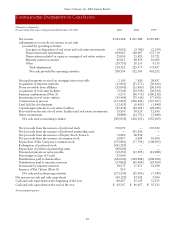
C
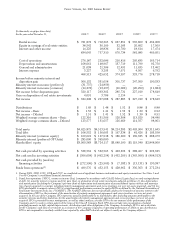
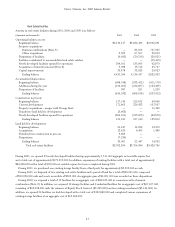
ONSOLIDATED
S
TATEMENTS OF
I
NCOME
(Amounts in thousands, except share data)
For each of the three years in the period ended December 31, 2001
2001 2000 1999
Revenues:
Rental income:
Self-storage facilities $721,662 $653,110 $592,619
Commercial properties 12,530 11,341 8,204
Containerized storage facilities 47,686 37,914 27,028
Equity in earnings of real estate entities 38,542 36,109 32,183
Interest and other income 14,225 18,836 16,700
834,645 757,310 676,734
Expenses:
Cost of operations:
Storage facilities 229,211 210,462 184,481
Commercial properties 3,972 3,826 2,826
Containerized storage facilities 43,004 37,798 29,509
Depreciation and amortization 168,061 148,967 137,719
General and administrative 21,038 21,306 12,491
Interest expense 3,227 3,293 7,971
468,513 425,652 374,997
Income before minority interest and disposition gain 366,132 331,658 301,737
Minority interest in income:
Preferred partnership interests (31,737) (24,859) —
Other partnership interests (14,278) (13,497) (16,006)
Net income before disposition gain 320,117 293,302 285,731
Gain on disposition of real estate and real estate investments 4,091 3,786 2,154
Net income $324,208 $297,088 $287,885
Net income allocation:
Allocable to preferred shareholders $117,979 $100,138 $94,793
Allocable to Equity Stock, Series A 19,455 11,042 —
Allocable to common shareholders 186,774 185,908 193,092
$324,208 $297,088 $287,885
Per common share:
Basic net income per share $ 1.53 $ 1.41 $ 1.53
Diluted net income per share $ 1.51 $ 1.41 $ 1.52
Basic weighted average common shares outstanding 122,310 131,566 126,308
Diluted weighted average common shares outstanding 123,577 131,657 126,669
See accompanying notes.