Public Storage 2001 Annual Report Download - page 45
Download and view the complete annual report
Please find page 45 of the 2001 Public Storage annual report below. You can navigate through the pages in the report by either clicking on the pages listed below, or by using the keyword search tool below to find specific information within the annual report.-
 1
1 -
2
-
3
-
4
-
5
-
6
-
7
-
8
-
9
-
10
-
11
-
12
-
13
-
14
-
15
-
16
-
17
-
18
-
19
-
20
-
21
-
22
-
23
-
24
-
25
-
26
-
27
-
28
-
29
-
30
-
31
-
32
-
33
-
34
-
 35
35 -
 36
36 -
 37
37 -
 38
38 -
 39
39 -
 40
40 -
 41
41 -
 42
42 -
 43
43 -
 44
44 -
 45
45 -
 46
46 -
 47
47 -
 48
48 -
 49
49 -
 50
50 -
 51
51 -
 52
52 -
 53
53 -
 54
54 -
 55
55 -
56
-
57
-
58
-
59
-
60
-
61
-
62
-
63
-
64
-
65
-
66
 |
 |

43
P
UBLIC
S
TORAGE
,I
NC
. 2001 A
NNUAL
R
EPORT
We believe that principally as a result of our more aggressive rental rates and reductions in the amount of promotional
discounts, and partially as a result of the national economic contraction (discussed below), our weighted average occupancy levels
decreased during 2001 as compared to 2000. Our occupancy levels through the first two months of fiscal 2002 continued to
trend downward, with the Consistent Group’s average occupancy level at 83.4% at February 28, 2002 as compared to 88.9% at
February 28, 2001. While the occupancy level at February 28, 2002 is significantly lower than the average occupancy levels
experienced during the year, some decreases in occupancy are expected due to minor seasonal fluctuations in occupancies.
Occupancies are generally higher in the summer months than in the winter months. We therefore believe that the comparison
of occupancies at February 28, 2001 versus that at February 28, 2002 provides a more meaningful measure of occupancy trends.
We believe that the national economic contraction has also contributed to our decreasing occupancies; however, it is difficult to
isolate the impact of the downturn from our aforementioned pricing decisions. While there can be no assurance, we believe that the
potential impact of regional downturns are partially mitigated by the geographic diversification and quality locations of our facilities.
Our storage facilities are geographically diversified and are located primarily in or near major metropolitan markets in 37 states.
We are continuously evaluating our call volume, reservation activity, and move-in/move-out rates for each of our markets
relative to our marketing activities and rental rates. In addition, we are evaluating market supply and demand factors and based
upon these analyses we are continuing to adjust our marketing activities, and are currently reducing rental rates charged to new
incoming tenants in an effort to increase our occupancy levels.
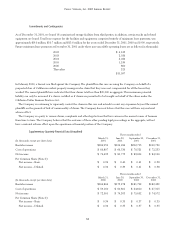
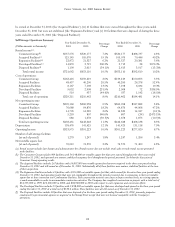
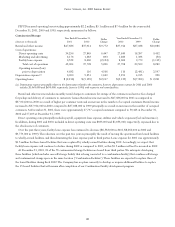
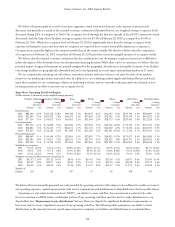
Cost of operations includes all direct and indirect costs of operating, marketing and managing the facilities. The following table
summarizes major operating expenses with respect to the Consistent Group (in thousands):
2001 2000 1999
Property payroll expense $ 44,114 $ 44,705 $ 43,502
Property taxes 45,566 45,403 45,546
Repairs and maintenance 12,560 15,191 12,597
Advertising 15,233 8,317 7,317
Telephone reservation center costs 7,967 9,338 7,668
Utilities 12,182 11,616 11,356
Management, office, insurance, and other expenses 24,794 24,649 22,869
Total cost of operations $162,416 $159,219 $150,855
Increases in advertising cost include the impact of expanded yellow page advertising in telephone directories. The increase in
advertising cost in 2001 as compared to 2000 also includes the impact of a $6,072,000 increase in Consistent Group television
advertising expenditures. Promotional advertising is an important part of our operational strategy. Our advertising activities have
increased customer call volume into our national reservation system, where one of our representatives discusses with the customer
space requirements, price and location preferences and also informs the customer of other products and services provided by the
Company and its subsidiaries.
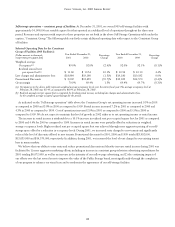
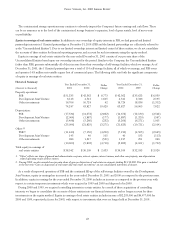
Self-storage operations – acquired facilities: As of December 31, 2001, we had 267 facilities with 14,897,000 net rentable square
feet that we acquired in 1999 (242) and 2000 (25) in connection with business combinations described more fully in
Note 3 to the Company’s financial statements, as well as certain third-party acquisitions of facilities. Substantially all of these
facilities were mature, stabilized facilities at the time of their acquisition. The operations of these facilities are included in the
above table under the caption “Acquired Facilities.”