Public Storage 2001 Annual Report Download - page 42
Download and view the complete annual report
Please find page 42 of the 2001 Public Storage annual report below. You can navigate through the pages in the report by either clicking on the pages listed below, or by using the keyword search tool below to find specific information within the annual report.-
 1
1 -
2
-
3
-
4
-
5
-
6
-
7
-
8
-
9
-
10
-
11
-
12
-
13
-
14
-
15
-
16
-
17
-
18
-
19
-
20
-
21
-
22
-
23
-
24
-
25
-
26
-
27
-
28
-
29
-
30
-
31
-
 32
32 -
 33
33 -
 34
34 -
 35
35 -
 36
36 -
 37
37 -
 38
38 -
 39
39 -
 40
40 -
 41
41 -
 42
42 -
 43
43 -
 44
44 -
 45
45 -
 46
46 -
 47
47 -
 48
48 -
 49
49 -
 50
50 -
 51
51 -
 52
52 -
53
-
54
-
55
-
56
-
57
-
58
-
59
-
60
-
61
-
62
-
63
-
64
-
65
-
66
 |
 |

40
P
UBLIC
S
TORAGE
,I
NC
. 2001 A
NNUAL
R
EPORT
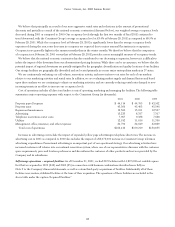
Results of Operations:
Net income and earnings per common share: Net income for 2001, 2000 and 1999 was $324,208,000, $297,088,000 and
$287,885,000, respectively. The increase in net income was primarily the result of improved property operations, reduced
operating losses from the containerized storage business, and the acquisition of additional real estate investments during 1999,
2000 and 2001. The impact of these items was offset partially by an increased allocation of income to minority interests (as a
result of the issuance of preferred operating partnership units, referred to below) combined with an increase in depreciation
and general and administration expense during 2000 and 2001 when compared to 1999.
During 2000, our capital raising activities included the issuance of approximately $365 million in preferred operating
partnership units in one of our controlled partnerships ($80 million of which was repurchased in 2001). Unlike distributions
to preferred shareholders, distributions to preferred unitholders are presented as minority interest in income and a reduction in
computing the Company’s net income. Primarily as a result of these preferred distributions, minority interest in income increased
to $46,015,000 and $38,356,000 for 2001 and 2000, respectively, as compared to $16,006,000 for 1999.
Net income allocable to common shareholders for 2001, 2000 and 1999 was $186,774,000, $185,908,000 and $193,092,000,
respectively. On a diluted basis, net income was $1.51 per common share (based on diluted weighted average common equivalent
shares outstanding of 123,577,000) for 2001, $1.41 per common share (based on diluted weighted average common equivalent
shares outstanding of 131,657,000) for 2000 and $1.52 per common share (based on diluted weighted average common
equivalent shares outstanding of 126,669,000) for 1999. The increase in net income per common share in 2001 as compared
to 2000 is primarily due to a reduction in our weighted average shares outstanding due to our share repurchase activities. The
decrease in net income per common share in 2000 as compared to 1999 reflects the inclusion of 6,790,000 common equivalent
shares related to the Company’s Class B common shares in 2000, but not in 1999, as described more fully below.
In computing net income allocable to common shareholders for each period, aggregate dividends paid to the holders of the
Equity Stock, Series A and preferred equity securities have been deducted in determining net income allocable to the common
shareholders. Distributions paid to the holders of the Equity Stock, Series A totaled $19,455,000 in 2001, $11,042,000 in 2000
and none in 1999. Distributions paid to preferred shareholders totaled $117,979,000 in 2001, $100,138,000 in 2000 and
$94,793,000 in 1999.
Commencing January 1, 2000, the Company’s 7,000,000 Class B common shares outstanding began to participate in
distributions of the Company’s earnings. Distributions per share of Class B common stock are equal to 97% of the per share
distribution paid to the Company’s regular common shares. As a result of this participation in distributions of earnings, for
purposes of computing net income per common share, the Company began to include 6,790,000 (7,000,000 x 97%) Class B
common shares in the weighted average common equivalent shares effective January 1, 2000. Weighted average diluted shares
for the year ended December 31, 1999 does not include any shares with respect to the Class B common stock as these shares
did not participate in distributions of the Company’s earnings prior to January 1, 2000.
Real Estate Operations:
Self-storage operations: Our self-storage operations are by far the largest component of our operations, representing
approximately 92% of rental revenues generated during 2001. At the end of 1998, we had a total of 951 self-storage facilities
included in our consolidated financial statements. Since that time we have increased the number of self-storage facilities by 319
(1999 – 255 facilities, 2000 – 41 facilities and 2001 – 23 facilities). As a result of significant acquisitions and development of self-
storage facilities over the past three years, year over year comparisons as presented on the consolidated statements of income with
respect to our self-storage operations are not meaningful.
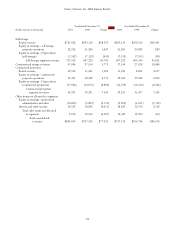
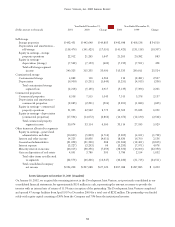
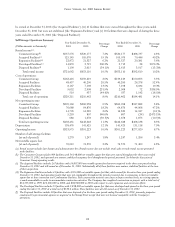
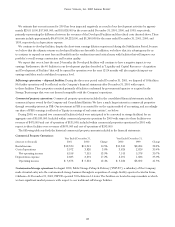
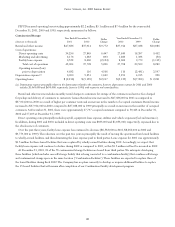
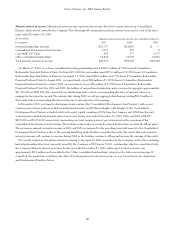
To enhance year over year comparisons, the following table summarizes, and the ensuing discussion describes, the operating
results of (i) 909 self-storage facilities that are reflected in the financial statements for the entire three years ended December 31,
2001 (the “Consistent Group”), (ii) 53 development facilities that were opened during the three years ended December 31, 2001
(the “Developed Facilities”), (iii) 267 facilities that were acquired in the three years ended December 31, 2001 and continued to