Public Storage 2001 Annual Report Download - page 12
Download and view the complete annual report
Please find page 12 of the 2001 Public Storage annual report below. You can navigate through the pages in the report by either clicking on the pages listed below, or by using the keyword search tool below to find specific information within the annual report.-
 1
1 -
 2
2 -
 3
3 -
 4
4 -
 5
5 -
 6
6 -
 7
7 -
 8
8 -
 9
9 -
 10
10 -
 11
11 -
 12
12 -
 13
13 -
 14
14 -
 15
15 -
 16
16 -
 17
17 -
 18
18 -
 19
19 -
 20
20 -
 21
21 -
 22
22 -
23
-
24
-
25
-
26
-
27
-
28
-
29
-
30
-
31
-
32
-
33
-
34
-
35
-
36
-
37
-
38
-
39
-
40
-
41
-
42
-
43
-
44
-
45
-
46
-
47
-
48
-
49
-
50
-
51
-
52
-
53
-
54
-
55
-
56
-
57
-
58
-
59
-
60
-
61
-
62
-
63
-
64
-
65
-
66
 |
 |

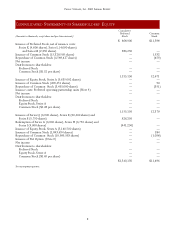
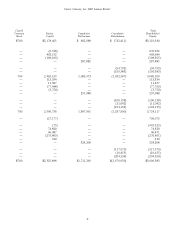
10
P
UBLIC
S
TORAGE
,I
NC
. 2001 A
NNUAL
R
EPORT
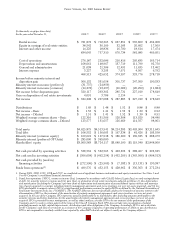
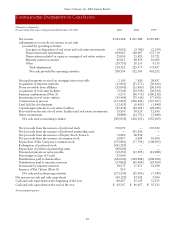
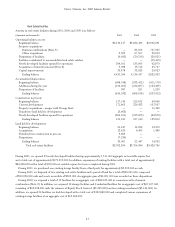
(Amounts in thousands)
For each of the three years in the period ended December 31, 2001
2001 2000 1999
Cash flows from operating activities:
Net income $ 324,208 $ 297,088 $ 287,885
Adjustments to reconcile net income to net cash
provided by operating activities:
Less gain on disposition of real estate and real estate investments (4,091) (3,786) (2,154)
Depreciation and amortization 168,061 148,967 137,719
Depreciation included in equity in earnings of real estate entities 25,096 21,825 19,721
Minority interest in income 46,015 38,356 16,006
Other (20,755) 20,115 4,115
Total adjustments 214,326 225,477 175,407
Net cash provided by operating activities 538,534 522,565 463,292
Cash flows from investing activities:
Principal payments received on mortgage notes receivable 2,199 7,650 28,837
Acquisition of minority interests (11,841) (31,271) (36,846)
Notes receivable from affiliates (35,000) (11,400) (30,594)
Acquisition of real estate facilities (3,503) (62,938) (26,640)
Business combinations (Note 3) 6,276 (66,776) (180,216)
Investments in real estate entities (55,468) (75,146) (77,656)
Construction in process (171,865) (226,423) (107,567)
Land held for development (12,425) (6,495) (1,480)
Capital improvements to real estate facilities (35,478) (33,023) (29,023)
Proceeds from the sale of real estate facilities and real estate investments 19,936 58,319 12,656
Other investments (8,889) (14,751) (3,680)
Net cash used in investing activities (306,058) (462,254) (452,209)
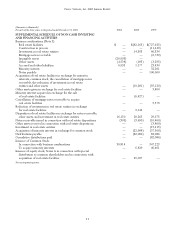
Cash flows from financing activities:
Net proceeds from the issuance of preferred stock 799,073 — 276,932
Net proceeds from the issuance of preferred partnership units — 361,250 —
Net proceeds from the issuance of Equity Stock, Series A 74,820 68,318 —
Net proceeds from the issuance of common stock 15,857 4,608 10,000
Repurchase of the Company’s common stock (276,861) (77,799) (108,565)
Redemption of preferred stock (441,325) — —
Repurchase of preferred partnership units (80,000) — —
Principal payments on notes payable (12,451) (11,335) (14,088)
Borrowings on Line of Credit 25,000 — —
Distributions paid to shareholders (342,030) (343,388) (208,090)
Distributions paid to minority interests (53,862) (45,494) (25,300)
Investment by minority interests 18,273 17,871 61,928
Issuance of Put Option (Note 9) 910 — —
Net cash used in financing activities (272,596) (25,969) (7,183)
Net increase in cash and cash equivalents (40,120) 34,342 3,900
Cash and cash equivalents at the beginning of the year 89,467 55,125 51,225
Cash and cash equivalents at the end of the year $ 49,347 $ 89,467 $ 55,125
See accompanying notes.
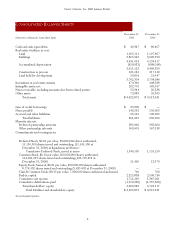
C
ONSOLIDATED
S
TATEMENTS OF
C
ASH
F
LOWS