Public Storage 2001 Annual Report Download - page 3
Download and view the complete annual report
Please find page 3 of the 2001 Public Storage annual report below. You can navigate through the pages in the report by either clicking on the pages listed below, or by using the keyword search tool below to find specific information within the annual report.-
 1
1 -
 2
2 -
 3
3 -
 4
4 -
 5
5 -
 6
6 -
 7
7 -
 8
8 -
 9
9 -
 10
10 -
 11
11 -
 12
12 -
 13
13 -
 14
14 -
15
-
16
-
17
-
18
-
19
-
20
-
21
-
22
-
23
-
24
-
25
-
26
-
27
-
28
-
29
-
30
-
31
-
32
-
33
-
34
-
35
-
36
-
37
-
38
-
39
-
40
-
41
-
42
-
43
-
44
-
45
-
46
-
47
-
48
-
49
-
50
-
51
-
52
-
53
-
54
-
55
-
56
-
57
-
58
-
59
-
60
-
61
-
62
-
63
-
64
-
65
-
66
 |
 |

P
UBLIC
S
TORAGE
,I
NC
. 2001 A
NNUAL
R
EPORT
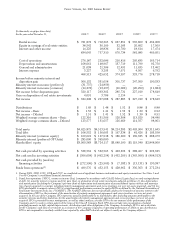
S
ELECTED
F
INANCIAL
H
IGHLIGHTS
1
(In thousands, except per share data)
For the year ended December 31,
2001
(1)
2000
(1)
1999
(1)
1998
(1)
1997
(1)
Revenues:
Rental income $ 781,878 $ 702,365 $ 627,851 $ 535,869 $ 434,008
Equity in earnings of real estate entities 38,542 36,109 32,183 26,602 17,569
Interest and other income 14,225 18,836 16,700 18,614 17,474
834,645 757,310 676,734 581,085 469,051
Expenses:
Cost of operations 276,187 252,086 216,816 205,835 165,714
Depreciation and amortization 168,061 148,967 137,719 111,799 92,750
General and administrative 21,038 21,306 12,491 11,635 13,462
Interest expense 3,227 3,293 7,971 4,507 6,792
468,513 425,652 374,997 333,776 278,718
Income before minority interest and
disposition gain 366,132 331,658 301,737 247,309 190,333
Minority interest in income (preferred) (31,737) (24,859) — — —
Minority interest in income (common) (14,278) (13,497) (16,006) (20,290) (11,684)
Net income before disposition gain 320,117 293,302 285,731 227,019 178,649
Gain on disposition of real estate investments 4,091 3,786 2,154 — —
Net income $ 324,208 $ 297,088 $ 287,885 $ 227,019 $ 178,649
Per Common Share:
Distributions $ 1.69 $ 1.48 $ 1.52 $ 0.88 $ 0.88
Net income – Basic $ 1.53 $ 1.41 $ 1.53 $ 1.30 $ 0.92
Net income – Diluted $ 1.51 $ 1.41 $ 1.52 $ 1.30 $ 0.91
Weighted average common shares – Basic 122,310 131,566 126,308 113,929 98,446
Weighted average common shares – Diluted 123,577 131,657 126,669 114,357 98,961
Balance Sheet Data:
Total assets $4,625,879 $4,513,941 $4,214,385 $3,403,904 $3,311,645
Total debt $ 168,552 $ 156,003 $ 167,338 $ 81,426 $ 103,558
Minority interest (common equity) $ 169,601 $ 167,918 $ 186,600 $ 139,325 $ 288,479
Minority interest (preferred OP Units) $ 285,000 $ 365,000———
Shareholders’ equity $3,909,583 $3,724,117 $3,689,100 $3,119,340 $2,848,960
Other Data:
Net cash provided by operating activities $ 538,534 $ 522,565 $ 463,292 $ 388,407 $ 292,325
Net cash used in investing activities $ (306,058) $ (462,254) $ (452,209) $ (365,506) $ (408,313)
Net cash provided by (used in)
financing activities $ (272,596) $ (25,969) $ (7,183) $ (13,131) $ 130,587
Funds from operations
(2)
$ 499,576 $ 452,155 $ 428,962 $ 336,363 $ 272,234
1. During 2001, 2000, 1999, 1998 and 1997, we completed several significant business combinations and equity transactions. See Notes 3 and
9 to the Company’s consolidated financial statements.
2. Funds from operations (“FFO”), means net income (loss) (computed in accordance with GAAP) before (i) gain (loss) on early extinguishment
of debt, (ii) minority interest in income and (iii) gain (loss) on disposition of real estate investments, adjusted as follows: (i) plus depreciation
and amortization (including the Company’s pro-rata share of depreciation and amortization of unconsolidated equity interests and amortiza-
tion of assets acquired in a merger, including property management agreements and excess purchase cost over net assets acquired), and (ii) less
FFO attributable to minority interest. FFO is a supplemental performance measure for equity REITs as defined by the National Association of
Real Estate Investment Trusts, Inc. (“NAREIT”). The NAREIT definition does not specifically address the treatment of minority interest in the
determination of FFO or the treatment of the amortization of property management agreements and excess purchase cost over net assets
acquired. In the case of the Company, FFO represents amounts attributable to its shareholders after deducting amounts attributable to the
minority interests and before deductions for the amortization of property management agreements and excess purchase cost over net assets
acquired. FFO is presented because management, as well as many analysts, consider FFO to be one measure of the performance of the
Company and it is used in certain aspects of the terms of the Class B Common Stock. FFO does not take into consideration scheduled
principal payments on debt, capital improvements, distributions and other obligations of the Company. Accordingly, FFO is not a substitute
for the Company’s cash flow or net income as a measure of the Company’s liquidity or operating performance or ability to pay distributions.
FFO is not comparable to similarly entitled items reported by other REITs that do not define it exactly as the Company defines it.