Public Storage 2001 Annual Report Download - page 44
Download and view the complete annual report
Please find page 44 of the 2001 Public Storage annual report below. You can navigate through the pages in the report by either clicking on the pages listed below, or by using the keyword search tool below to find specific information within the annual report.-
 1
1 -
2
-
3
-
4
-
5
-
6
-
7
-
8
-
9
-
10
-
11
-
12
-
13
-
14
-
15
-
16
-
17
-
18
-
19
-
20
-
21
-
22
-
23
-
24
-
25
-
26
-
27
-
28
-
29
-
30
-
31
-
32
-
33
-
 34
34 -
 35
35 -
 36
36 -
 37
37 -
 38
38 -
 39
39 -
 40
40 -
 41
41 -
 42
42 -
 43
43 -
 44
44 -
 45
45 -
 46
46 -
 47
47 -
 48
48 -
 49
49 -
 50
50 -
 51
51 -
 52
52 -
 53
53 -
 54
54 -
55
-
56
-
57
-
58
-
59
-
60
-
61
-
62
-
63
-
64
-
65
-
66
 |
 |

42
P
UBLIC
S
TORAGE
,I
NC
. 2001 A
NNUAL
R
EPORT
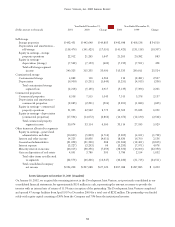
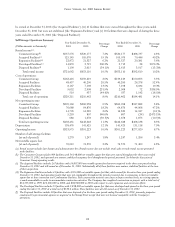
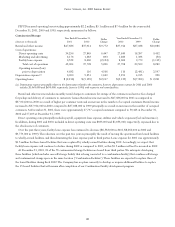
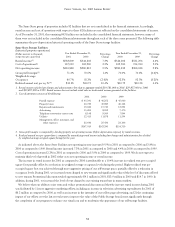
Self-storage operations – consistent group of facilities: At December 31, 2001, we owned 909 self-storage facilities with
approximately 54,148,000 net rentable square feet that operated at a stabilized level of operations throughout the three-year
period. Revenues and expenses with respect to these properties are set forth in the above Self-Storage Operations table under the
caption, “Consistent Group.” The following table sets forth certain additional operating data with respect to the Consistent Group
of facilities:
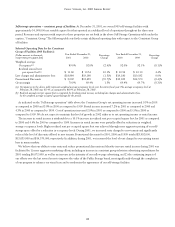
Selected Operating Data for the Consistent
Group of Facilities (909 Facilities):
(Dollar amounts in thousands,
Year Ended December 31, Percentage Year Ended December 31, Percentage
except rents per square foot)
2001 2000 Change 2000 1999 Change
Weighted average:
Occupancy
(a)
89.6% 92.0% (2.4)% 92.0% 92.1% (0.1)%
Realized annual rent
per square foot
(b).
$ 11.60 $ 10.54 10.1% $ 10.54 $ 10.10 4.4%
Late charges and administrative fees $18,884 $19,180 (1.5)% $19,180 $19,182 0.0%
Promotional Discounts $ 3,992 $13,635 (70.7)% $13,635 $14,570 (6.4)%
Gross margin 70.9% 69.4% 1.5% 69.4% 69.7% (0.3)%
(a) Occupancies in the above table represent weighted average occupancy levels over the entire fiscal year. The average occupancy level at
February 28, 2002 was 83.4% as compared to 88.9% at February 28, 2001.
(b) Realized annual rent per square foot is computed by dividing rental income, including late charges and administrative fees,
by the weighted average occupied square footage for the period.
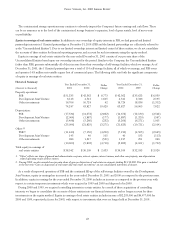
As indicated on the “Self-storage operations” table above, the Consistent Group’s net operating income increased 9.5% in 2001
as compared to 2000 and 3.8% in 2000 as compared to 1999. Rental income increased 7.2% in 2001 as compared to 2000 and
4.3% in 2000 as compared to 1999. Cost of operations increased 2.0% in 2001 as compared to 2000 and 5.5% in 2000 as
compared to 1999. We do not expect to maintain this level of growth in 2002 either as to net operating income or rental income.
The increase in rental income is attributable to a 10.1% increase in realized rent per occupied square foot for 2001 as compared
to 2000 and 4.4% for 2000 as compared to 1999. Increases in rental income were partially offset by reductions in weighted
average occupancy levels. Higher realized rent per occupied square foot was achieved through more aggressive pricing of our self-
storage space offset by a reduction in occupancy levels. During 2001, we increased rents charged to new tenants and significantly
reduced the level of discounts offered to new tenants. Promotional discounts for 2001, 2000 and 1999 totaled $3,992,000,
$13,635,000 and $14,570,000, respectively. In addition, during 2001, we increased the level of rent charged to our existing tenant
base in many markets.
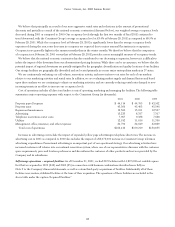
We believe that our ability to raise rents and reduce promotional discounts and thereby increase rental income during 2001 was
facilitated by 1) more aggressive marketing efforts, including an increase in consistent group television advertising expenditures for
2001 totaling $6,072,000, as well as an increase in the intensity of our yellow page advertising, and 2) the continuing impact of
our efforts over the last several years to improve the value of the Public Storage brand, most significantly through the completion
of our program to enhance our visual icon and to modernize the appearance of our self-storage facilities.