North Face 2004 Annual Report Download - page 55
Download and view the complete annual report
Please find page 55 of the 2004 North Face annual report below. You can navigate through the pages in the report by either clicking on the pages listed below, or by using the keyword search tool below to find specific information within the annual report.-
 1
1 -
2
-
3
-
4
-
5
-
6
-
7
-
8
-
9
-
10
-
11
-
12
-
13
-
14
-
15
-
16
-
17
-
18
-
19
-
20
-
21
-
22
-
23
-
24
-
25
-
26
-
27
-
28
-
29
-
30
-
31
-
32
-
33
-
34
-
35
-
36
-
37
-
38
-
39
-
40
-
41
-
42
-
43
-
44
-
 45
45 -
 46
46 -
 47
47 -
 48
48 -
 49
49 -
 50
50 -
 51
51 -
 52
52 -
 53
53 -
 54
54 -
 55
55 -
 56
56 -
 57
57 -
 58
58
 |
 |

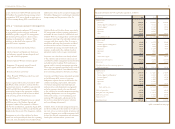
105vf corporation 2004 Annual Report
Dollars in thousands, except per share amounts 2004 2003 2002 2001 2000 1999 1998 1997 1996 1995 1994
Summary of Operations
Net sales $6,054,536 $ 5,207,459 $ 5,083,523 $ 5,220,417 $ 5,403,123 $ 5,193,747 $ 5,090,109 $ 4,728,784 $ 4,697,624 $ 4,613,512 $ 4,517,836
Operating income 777,788 644,889 621,924 454,427 505,558 638,422 670,090 555,147 511,239 316,152 516,558
Income from continuing operations 474,702 397,933 364,428 217,278 265,951 359,539 377,078 321,279 272,370 140,082 267,118
Discontinued operations –– 8,283 (79,448) 1,165 6,703 11,228 29,663 27,154 17,209 7,418
Cumulative effect of change in accounting policy ––(527,254) – (6,782) – – – – – –
Net income (loss) 474,702 397,933 (154,543) 137,830 260,334 366,242 388,306 350,942 299,524 157,291 274,536
Earnings (loss) per common share – basic (1)
Income from continuing operations $4.30 $ 3.67 $ 3.26 $ 1.90 $ 2.29 $ 2.98 $ 3.07 $ 2.52 $ 2.11 $ 1.07 $ 2.04
Discontinued operations –– 0.08 (0.71) 0.01 0.06 0.10 0.24 0.21 0.13 0.06
Cumulative effect of change in accounting policy ––(4.83) – (0.06) – – – – – –
Net income (loss) 4.30 3.67 (1.49) 1.19 2.25 3.04 3.17 2.76 2.32 1.20 2.10
Earnings (loss) per common share – diluted(1)
Income from continuing operations $4.21 $ 3.61 $ 3.24 $ 1.89 $ 2.26 $ 2.93 $ 3.01 $ 2.47 $ 2.07 $ 1.06 $ 1.99
Discontinued operations –– 0.07 (0.69) 0.01 0.06 0.09 0.23 0.21 0.13 0.06
Cumulative effect of change in accounting policy ––(4.69) – (0.06) – – – – – –
Net income (loss) 4.21 3.61 (1.38) 1.19 2.21 2.99 3.10 2.70 2.28 1.19 2.05
Dividends per share 1.05 1.01 .97 .93 .89 .85 .81 .77 .73 .69 .65
Average number of common shares outstanding 109,872 107,713 109,167 111,294 114,075 118,538 120,744 125,504 127,292 127,486 129,240
Financial Position
Working capital $1,006,354 $ 1,419,281 $ 1,199,696 $ 1,217,587 $ 1,103,896 $ 763,943 $ 815,146 $ 835,558 $ 940,059 $ 799,317 $ 638,834
Current ratio 1.7 2.8 2.4 2.5 2.1 1.7 1.8 2.1 2.2 1.9 1.7
Total assets $5,004,278 $ 4,245,552 $ 3,503,151 $ 4,103,016 $ 4,358,156 $ 4,026,514 $ 3,836,666 $ 3,322,782 $ 3,449,535 $ 3,447,071 $ 3,335,608
Long-term debt 556,639 956,383 602,287 904,035 905,036 517,834 521,657 516,226 519,058 614,217 516,700
Redeemable preferred stock 26,053 29,987 36,902 45,631 48,483 51,544 54,344 56,341 58,092 60,667 62,195
Common stockholders’ equity 2,513,241 1,951,307 1,657,848 2,112,796 2,191,813 2,163,818 2,066,308 1,866,769 1,973,739 1,771,506 1,734,009
Debt to capital ratio (2) 28.5%33.7%28.6%31.7%34.7%30.1%27.1%22.5%21.4%32.3%32.7%
Other Statistics(4)
Operating margin 12.8%12.4%12.2%8.7%9.4%12.3%13.2%11.7%10.9%6.9%11.4%
Return on capital(2) (3) 15.8%16.6%16.9%8.0%9.6%12.9%15.1%13.6%11.9%6.5%11.7%
Return on average common stockholders’ equity 21.2%22.3%22.1%9.8%12.1%17.3%19.7%18.2%16.2%8.8%16.8%
Return on average total assets 10.1%10.5%10.4%5.0%6.1%8.9%10.2%10.1%8.6%4.4%7.9%
Cash provided by operations $ 730,256 $ 543,704 $ 645,584 $ 600,556 $ 434,381 $ 383,759 $ 382,547 $ 395,056 $ 648,348 $ 289,690 $ 436,602
Purchase of Common Stock –61,400 124,623 146,592 105,723 149,075 147,398 391,651 61,483 86,251 27,878
Dividends 117,731 111,258 108,773 106,864 104,920 104,302 101,660 100,141 97,036 92,038 88,223
Market Data(4)
Market price range(1) $55.61 – 42.06 $ 44.08 – 32.62 $ 45.64 – 31.50 $ 42.70 – 28.15 $ 36.90 – 20.94 $ 55.00 – 27.44 $ 54.69 – 33.44 $ 48.25 – 32.25 $ 34.94 – 23.81 $ 28.56 – 23.38 $ 26.88 – 22.13
Book value per common share(1) 22.56 18.04 15.28 19.21 19.52 18.62 17.30 15.40 15.44 13.96 13.51
Price earnings ratio –high-low (5) 13.2 – 10.0 12.2 – 9.0 14.1 – 9.7 22.6 – 14.9 16.3 – 9.3 18.8 – 9.4 18.2 – 11.1 19.5 – 13.1 16.9 – 11.5 26.9 – 22.1 13.5 – 11.1
Rate of payout (6) 24.9%28.0%29.9%49.2%39.4%29.0%26.9%31.2%35.3%65.1%32.7%
(1) Per share computations and market price ranges have been adjusted to reflect a two-for-one stock split in November 1997.
(2) Capital is defined as average common stockholders’ equity plus short-term and long-term debt.
(3) Return on capital is based on operating income plus miscellaneous income (expense), net of income taxes.
(4) Operating statistics and market data are based on continuing operations.
(5) Market price divided by income from continuing operations per diluted share.
(6) Dividends per share divided by earnings from continuing operations per diluted share.
vf corporation financial summary