North Face 2004 Annual Report Download - page 39
Download and view the complete annual report
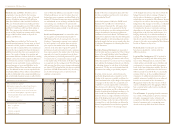
Please find page 39 of the 2004 North Face annual report below. You can navigate through the pages in the report by either clicking on the pages listed below, or by using the keyword search tool below to find specific information within the annual report.-
 1
1 -
2
-
3
-
4
-
5
-
6
-
7
-
8
-
9
-
10
-
11
-
12
-
13
-
14
-
15
-
16
-
17
-
18
-
19
-
20
-
21
-
22
-
23
-
24
-
25
-
26
-
27
-
28
-
 29
29 -
 30
30 -
 31
31 -
 32
32 -
 33
33 -
 34
34 -
 35
35 -
 36
36 -
 37
37 -
 38
38 -
 39
39 -
 40
40 -
 41
41 -
 42
42 -
 43
43 -
 44
44 -
 45
45 -
 46
46 -
 47
47 -
 48
48 -
 49
49 -
50
-
51
-
52
-
53
-
54
-
55
-
56
-
57
-
58
 |
 |

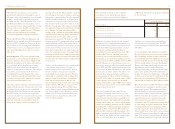
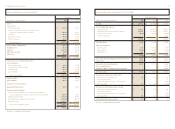
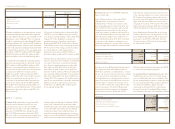
73vf corporation 2004 Annual Report
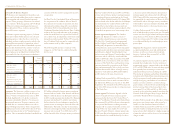
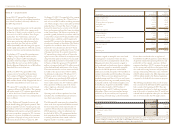
consolidated statements of comprehensive income
Year Ended December
In thousands 2004 2003 2002
net income (loss) $ 474,702 $397,933 $ (154,543)
other comprehensive income (loss)
Foreign currency translation
Amount arising during year 61,716 89,000 40,693
Less income tax effect (31,647) (40,157) (15,252)
Minimum pension liability adjustment
Amount arising during year 65,969 (52,691) (205,080)
Less income tax effect (24,257) 20,335 78,239
Derivative financial instruments
Amount arising during year (9,924) (14,492) (15,802)
Less income tax effect 3,802 5,536 6,168
Reclassification to net income for losses realized 8,803 15,817 280
Less income tax effect (3,372) (6,042) (107)
Unrealized gains and losses on marketable securities
Amount arising during year 9,808 13,730 (3,184)
Less income tax effect (3,842) (5,369) 1,255
Reclassification to net income for (gains) losses realized (1,105) (1,613) 2,763
Less income tax effect 433 632 (1,074)
comprehensive income (loss) $ 551,086 $422,619 $ (265,644)
See notes to consolidated financial statements.
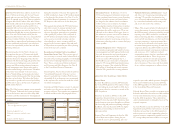
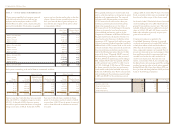
consolidated statements of cash flows
Year Ended December
In thousands 2004 2003 2002
operating activities
Net income (loss) $ 474,702 $ 397,933 $ (154,543)
Adjustments to reconcile net income (loss) to cash provided
by operating activities of continuing operations:
Discontinued operations –– (8,283)
Cumulative effect of a change in accounting policy – – 527,254
Restructuring costs – – 26,342
Depreciation 110,868 104,463 107,398
Amortization and impairment 29,849 13,675 16,285
Provision for doubtful accounts 3,516 11,197 18,490
Pension funding in excess of expense (236) (21,785) 3,770
Deferred income taxes 16,172 30,961 70,849
Stock-based compensation 10,956 1,584 1,003
Other, net 20,984 12,543 (12,990)
Changes in operating assets and liabilities, net of acquisitions:
Accounts receivable (20,301) 47,502 (24,077)
Inventories 51,450 61,596 43,253
Other current assets (19,006) 22,865 (135)
Accounts payable 3,812 (60,636) 54,123
Accrued compensation 48,897 (42,823) 28,697
Other accrued liabilities (1,407) (35,371) (51,852)
Cash provided by operating activities of continuing operations 730,256 543,704 645,584
investing activities
Capital expenditures (81,410) (86,619) (64,503)
Business acquisitions, net of cash acquired (655,089) (578,038) (1,342)
Software purchases (13,018) (12,775) (12,141)
Sale of property, plant and equipment 12,900 17,964 25,731
Sale of VF Playwear business 4,517 – –
Other, net (103) (51) 7,675
Cash used by investing activities of continuing operations (732,203) (659,519) (44,580)
financing activities
Decrease in short-term borrowings (19,056) (30,080) (16,586)
Proceeds from long-term debt –292,110 –
Payments on long-term debt (3,494) (16,183) (301,564)
Purchase of Common Stock –(61,400) (124,623)
Cash dividends paid (117,731) (111,258) (108,773)
Proceeds from issuance of Common Stock 106,613 32,631 39,753
Other, net (730) (510) (8,290)
Cash provided (used) by financing activities of continuing operations (34,398) 105,310 (520,083)
net cash provided (used) by discontinued operations (3,320) (1,417) 69,899
effect of foreign currency rate changes on cash 10,387 30,340 13,498
net change in cash and equivalents (29,278) 18,418 164,318
cash and equivalents – beginning of year 514,785 496,367 332,049
cash and equivalents – end of year $ 485,507 $ 514,785 $ 496,367
See notes to consolidated financial statements.