North Face 2004 Annual Report Download - page 32
Download and view the complete annual report
Please find page 32 of the 2004 North Face annual report below. You can navigate through the pages in the report by either clicking on the pages listed below, or by using the keyword search tool below to find specific information within the annual report.-
 1
1 -
2
-
3
-
4
-
5
-
6
-
7
-
8
-
9
-
10
-
11
-
12
-
13
-
14
-
15
-
16
-
17
-
18
-
19
-
20
-
21
-
 22
22 -
 23
23 -
 24
24 -
 25
25 -
 26
26 -
 27
27 -
 28
28 -
 29
29 -
 30
30 -
 31
31 -
 32
32 -
 33
33 -
 34
34 -
 35
35 -
 36
36 -
 37
37 -
 38
38 -
 39
39 -
 40
40 -
 41
41 -
 42
42 -
43
-
44
-
45
-
46
-
47
-
48
-
49
-
50
-
51
-
52
-
53
-
54
-
55
-
56
-
57
-
58
 |
 |

59vf corporation 2004 Annual Report
For the ratio of debt to total capital, debt is defined
as short-term and long-term borrowings, and total
capital is defined as debt plus common stockholders’
equity. Our ratio of net debt to total capital, with
net debt defined as debt less cash and equivalents,
was 17.0% at the end of 2004.
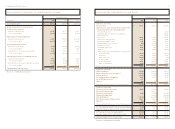
VF’s primary source of liquidity is its strong cash flow
provided by operations, which was $730.3 million
in 2004, $543.7 million in 2003 and $645.6 million
in 2002. Cash flow from operations is primarily
dependent on the level of operating income and
controlling investments in inventories and other
working capital components. Income from continuing
operations increased significantly in 2004 over 2003,
and in 2003 over 2002. The net change in working
capital components during 2004 and during 2002
resulted in $63.4 million and $50.0 million, respec-
tively, of cash provided by operations, compared with
cash usage of $6.9 million in 2003. A major reason
for the year-to-year cash impact from changes in
working capital over this three year period related
to changes in incentive compensation, as amounts
earned in a year are paid early in the following year.
Cash provided by operating activities in 2004 included
approximately $11 million of cash provided by the
2004 Acquisitions (for the periods after their acquisi-
tion), while 2003 included approximately $60 million
of cash provided by Nautica (for the period after its
acquisition). Cash provided from operations resulting
from the liquidation of VF Playwear (but excluding
proceeds from sale of the business) was approximately
$40 million during 2004 (see Note C to the
Consolidated Financial Statements).
In addition to cash flow from operations, VF is well-
positioned to finance its ongoing operations and
meet unusual circumstances that may arise. VF has a
$750.0 million unsecured committed bank facility that
expires in September 2008. This bank facility supports
a $750.0 million commercial paper program. Any
issuance of commercial paper would reduce the
amount available under the bank facility. At the end
of 2004, $738.2 million was available for borrowing
under the credit agreement, with $11.8 million of
standby letters of credit issued under the agreement.
Further, under a registration statement filed in 1994
with the Securities and Exchange Commission,
VF has the ability to offer, on a delayed or continuous
basis, up to $300.0 million of additional debt, equity
or other securities.
The principal investing and financing activities in
2004 and 2003 related to acquisitions. We paid cash
of $655.1 million and $578.0 million for acquisitions
in 2004 and 2003, respectively, net of cash balances
in the acquired companies. The acquisitions were
funded with existing VF cash balances, short-term
commercial paper borrowings and, in 2003, $292.1
million borrowed in the long-term capital markets.
All commercial paper borrowings, plus debt of
the acquired companies of $28.8 million in 2004
and $14.9 million in 2003, were repaid during
the respective years, and we ended 2004 with
$485.5 million in cash and equivalents.
In April 2004, Standard & Poor’s Ratings Services
affirmed its ‘A minus’ long-term corporate credit
and senior unsecured debt ratings for VF. Standard
& Poor’s ratings outlook is ‘stable.’ Also in April
2004, Moody’s Investors Service affirmed VF’s long-
term debt rating of ‘A3’ and short-term debt rating
of ‘Prime-2’ and continued the ratings outlook
as ‘negative’. Based on current conditions, we do
not believe that the negative outlook by Moody’s
will have a material impact on VF’s ability to issue
long or short-term debt. Existing debt agreements
do not contain acceleration of maturity clauses based
on changes in credit ratings.
Capital expenditures were $81.4 million in 2004,
compared with $86.6 million and $64.5 million in
2003 and 2002, respectively. Capital expenditures in
each of these years generally related to maintenance
spending in our worldwide manufacturing and other
facilities. We expect that capital spending could
reach $120 million in 2005, with the increase related
to distribution projects and to higher retail store
investments. Capital spending will be funded by cash
flow from operations.
As discussed in the previous section, accumulated
benefit obligations in VF’s defined benefit pension
plans exceeded the fair value of plan assets by
$213.5 million at the plans’ latest valuation date.
We believe retirement benefits are important for our
associates, and accordingly, we are committed to
maintaining a well-funded pension plan. Although
VF was not required by applicable law to make any
funding contribution to the qualified pension plan
trust in 2004, 2003 and 2002 and will not be required
to do so in 2005, we made cash contributions of
$55.0 million in each of January 2005 and 2004
and $75.0 million in 2003. These contributions were
significantly higher than our contributions of
$20.0 million in each of the prior two years. We will
continue to monitor the funded status of the plan
and evaluate future funding levels. We believe VF has
adequate liquidity to meet future funding requirements.
During 2003, VF purchased 1.7 million shares of its
Common Stock in open market transactions at a cost
of $61.4 million (average price of $36.55 per share)
and in 2002 purchased 3.0 million shares at a cost
of $124.6 million (average price of $41.54 per share).
Under its current authorization from the Board of
Directors, VF may purchase an additional 5.3 million
shares. We suspended the share repurchase program
during the second quarter of 2003 through the end
of 2004 to fund acquisition spending. Our current
intent is to repurchase 2.0 million shares during 2005
to offset dilution caused by exercises of stock options.
However, the actual number purchased during 2005
may vary depending on funding required to support
business acquisition opportunities.
Cash dividends totaled $1.05 per common share
in 2004, compared with $1.01 in 2003 and $0.97
in 2002. Our target is to pay dividends totaling
approximately 30% of our diluted earnings per share
on a long-term basis. The dividend payout rate was
24.9% in 2004 compared with payout rates of 28.0%
in 2003 and 29.9% in 2002, based on income from
continuing operations. The current indicated annual
dividend rate for 2005 is $1.08 per share.
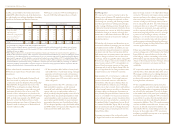
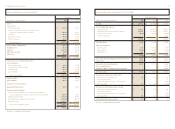
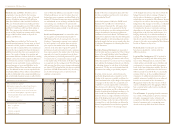
Dollars in millions 2004 2003
Working capital $1,006.4 $ 1,419.3
Current ratio 1.7 to 1 2.8 to 1
Debt to total capital 28.4%33.7%
Total Long-term Debt was relatively flat from 2003
to 2004, with $400.0 million of notes reclassified
to Current Portion of Long-term Debt based on
debt retirement schedules. Of the current portion,
$100.0 million is due on June 1, 2005 and $300.0
million is due on October 1, 2005.
Other Liabilities increased in 2004 by $17.5 million.
Included are increases of $43.6 million in liabilities
from growth in core businesses and $16.1 million in
deferred income taxes, offset by a $42.2 million reduc-
tion in our minimum pension liability. See Note N
to the Consolidated Financial Statements and the
following paragraph.
In VF’s defined benefit pension plans, accumulated
benefit obligations exceeded the fair value of plan
assets by $213.5 million at our plans’ last valuation
date. At the end of 2004, VF had a minimum pension
liability of $157.0 million (net of a prepaid pension
asset). The related charge to Accumulated Other
Comprehensive Income (Loss), net of income taxes,
was $119.1 million in 2004. Of the total minimum
pension liability, $55.0 million was recorded as a
current liability based on our contribution to the plan
in January 2005, and $102.0 million was recorded as
a long-term liability. The minimum pension liability at
the end of 2004 compares with $199.2 million at the
end of 2003 (of which $55.0 was classified as a current
liability) and a related charge to Accumulated Other
Comprehensive Income (Loss), net of income taxes,
of $160.9 million. The reduction in underfunding at
the end of 2004 resulted from growth in plan assets
and VF contributions made during the year.
Liquidity and Cash Flows
The financial condition of VF is reflected in the
following: