North Face 2004 Annual Report Download - page 53
Download and view the complete annual report
Please find page 53 of the 2004 North Face annual report below. You can navigate through the pages in the report by either clicking on the pages listed below, or by using the keyword search tool below to find specific information within the annual report.-
 1
1 -
2
-
3
-
4
-
5
-
6
-
7
-
8
-
9
-
10
-
11
-
12
-
13
-
14
-
15
-
16
-
17
-
18
-
19
-
20
-
21
-
22
-
23
-
24
-
25
-
26
-
27
-
28
-
29
-
30
-
31
-
32
-
33
-
34
-
35
-
36
-
37
-
38
-
39
-
40
-
41
-
42
-
 43
43 -
 44
44 -
 45
45 -
 46
46 -
 47
47 -
 48
48 -
 49
49 -
 50
50 -
 51
51 -
 52
52 -
 53
53 -
 54
54 -
 55
55 -
 56
56 -
 57
57 -
 58
58
 |
 |

101vf corporation 2004 Annual Report
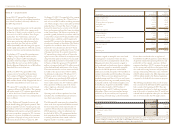
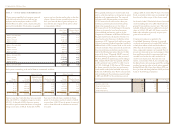
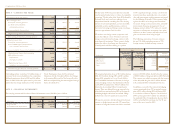
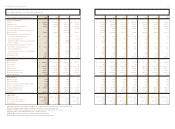
note t – earnings per share
note u – financial instruments
In thousands, except per share amounts 2004 2003 2002
Basic earnings per share:
Income from continuing operations $ 474,702 $ 397,933 $ 364,428
Less Preferred Stock dividends
and redemption premium 1,832 2,238 8,523
Income available for Common Stock $ 472,870 $ 395,695 $ 355,905
Weighted average Common Stock outstanding 109,872 107,713 109,167
Basic earnings per share from continuing operations $4.30 $ 3.67 $ 3.26
Diluted earnings per share:
Income from continuing operations $ 474,702 $ 397,933 $ 364,428
Increased ESOP expense if Preferred Stock
were converted to Common Stock –– 652
Income available for Common Stock and dilutive securities $ 474,702 $ 397,933 $ 363,776
Weighted average Common Stock outstanding 109,872 107,713 109,167
Effect of dilutive securities:
Preferred Stock 1,406 1,674 2,103
Stock options and other 1,452 936 1,066
Weighted average Common Stock
and dilutive securities outstanding 112,730 110,323 112,336
Diluted earnings per share from continuing operations $4.21 $ 3.61 $ 3.24
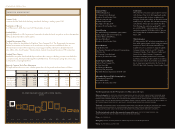
Outstanding options to purchase 5.0 million shares of
Common Stock were excluded from the computation
of diluted earnings per share in 2003 and 5.6 million
shares in 2002 because the option exercise prices were
greater than the average market price of the Common
Stock. Earnings per share for Discontinued
Operations, for the Cumulative Effect of a Change
in Accounting Policy and for Net Income (Loss) in
2002 are computed using the same weighted average
shares described above.
The fair value of VF’s long-term debt was estimated
based on quoted market prices or values of comparable
borrowings. The fair value of the Series B Redeemable
Preferred Stock was based on a valuation by an
independent financial consulting firm. The carrying
amounts of cash and equivalents, accounts receivable,
marketable securities and life insurance contracts,
short-term borrowings and foreign currency exchange
contracts approximates their fair value.
VF monitors net foreign currency exposures and
may in the ordinary course of business enter into
foreign currency forward exchange contracts with
major financial institutions. These contracts hedge
against the effects of exchange rate fluctuations
on anticipated cash flows relating to a portion
of VF’s significant foreign currency cash flows for
inventory purchases and production costs, product
sales and intercompany royalty payments anticipated
for the following 12 months. Other contracts hedge
against the effects of exchange rate fluctuations
on specific foreign currency transactions, primarily
intercompany financing arrangements. Use of
hedging contracts allows VF to reduce its overall
exposure to exchange rate movements since gains
and losses on these contracts will offset losses and
gains on the transactions being hedged.
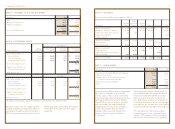
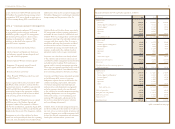
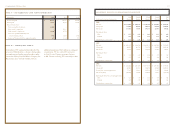
The following summarizes, by major currency,
the net U.S. dollar equivalent amount of VF’s
foreign currency forward exchange contracts:
VF recognized net pretax losses of $8.8 million during
2004, $15.8 million during 2003 and $0.3 million
during 2002, primarily in Cost of Goods Sold in
the Consolidated Statements of Income, for foreign
currency hedging contracts that had matured. At the
end of 2004, net pretax losses of $11.7 million were
deferred in Accumulated Other Comprehensive
Income. These net deferred losses are expected to be
reclassified into earnings during 2005 at the time the
underlying hedged transactions are realized. Hedge
ineffectiveness was not significant in any period.
VF may also enter into derivative financial instrument
contracts to hedge interest rate risks. VF entered into
a contract to hedge the interest rate risk for a notional
amount of $150.0 million shortly before the issuance
of $300.0 million of long-term debt in 2003 (Note L).
This contract was settled concurrent with the issuance
of the debt, with the gain of $3.5 million deferred
in Accumulated Other Comprehensive Income.
In addition, as a result of the interest rate hedging
contract mentioned above, VF recognized a pretax
gain of $0.1 million during 2004 and during 2003
as a reduction of Interest Expense. At the end of
2004, a pretax gain of $3.3 million was deferred in
Accumulated Other Comprehensive Income, which
will be reclassified into earnings over the 30 year
term of the notes issued in 2003.
2004 2003
Notional Value – Fair Value – Notional Value – Fair Value –
In thousands Bought (Sold) Asset (Liability) Bought (Sold) Asset (Liability)
European euro $(210,914) $ (9,877) $(73,439) $ (8,189)
Mexican peso 76,925 2,788 69,762 208
Canadian dollar (39,463) (2,842) (25,980) (1,302)
Other 8,465 – (11,928) –
$(9,931) $(9,283)
The carrying amount and fair value of financial instrument assets (liabilities) are as follows:
2004 2003
In thousands Carrying Amount Fair Value Carrying Amount Fair Value
Long-term debt $(957,871) $ (1,027,331) $(957,527) $ (1,038,544)
Series B Redeemable Preferred Stock (26,053) (74,769) (29,987) (66,169)