North Face 2004 Annual Report Download - page 2
Download and view the complete annual report
Please find page 2 of the 2004 North Face annual report below. You can navigate through the pages in the report by either clicking on the pages listed below, or by using the keyword search tool below to find specific information within the annual report.-
 1
1 -
 2
2 -
 3
3 -
 4
4 -
 5
5 -
 6
6 -
 7
7 -
 8
8 -
 9
9 -
 10
10 -
 11
11 -
 12
12 -
 13
13 -
14
-
15
-
16
-
17
-
18
-
19
-
20
-
21
-
22
-
23
-
24
-
25
-
26
-
27
-
28
-
29
-
30
-
31
-
32
-
33
-
34
-
35
-
36
-
37
-
38
-
39
-
40
-
41
-
42
-
43
-
44
-
45
-
46
-
47
-
48
-
49
-
50
-
51
-
52
-
53
-
54
-
55
-
56
-
57
-
58
 |
 |

01
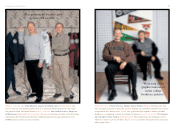
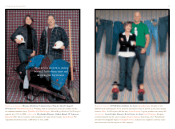
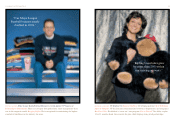
“The Lee jeans
brand is in
Canada to stay!”
B A R B A R A N A R D I N I Z I T E L L A Sales Account Executive, Wrangler & Lee Brands Canada
A Banner Year: 2004 was definitely the most energizing year in my 25-year career.
The success of Lee in Canada has been overwhelming and I’m very proud to have been
part of it. B R I A N W I L L I A M S VP, Wrangler & Lee Brands Canada & Puerto Rico
2005 and Beyond: W e have aggressive plans to fuel growth with exciting initiatives for
the retail community and great products for consumers.
“The Lee brand
experienced a
nearly threefold
sales increase in
Canada in 2004.”
200 F I N A N C I A L H I G H L I GH T S
Dollars in thousands, except per share amounts 2004 2003 2002
SU M M AR Y O F O P E R AT I O N S
Net sales $6,054,536 $ 5,207,459 $ 5,083,523
Operating income 777,788 644,889 621,924
Operating margin 12.8%12.4%12.2%
Income from continuing operations $ 474,702 $ 397,933 $364,428
Net income (loss)* 474,702 397,933 (154,543)
Return on capital (continuing operations) 15.8%16.6%16.9%
F I N AN C I AL P OSI T I ON
Working capital $1,006,354 $ 1,419,281 $1,199,696
Current ratio 1.7 to 1 2.8 to 1 2.4 to 1
Cash flow from operations $ 730,256 $ 543,704 $645,584
Debt to capital ratio 28.5%33.7%28.6%
Common stockholders’equity $2,513,241 $ 1,951,307 $1,657,848
P E R C O M M O N S H AR E
Income from continuing operations–diluted $4.21 $ 3.61 $3.24
Net income (loss) – diluted* 4.21 3.61 (1.38)
Dividends 1.05 1.01 .97
Book value 22.56 18.04 15.28
*Net income (loss) and related per share amounts include operating results of discontinued operations and the cumulative effect of a
change in accounting policy in 2002. See details in the accompanying consolidated financial statements.
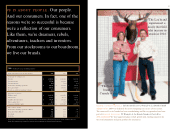
VF I S ABO UT P E OP LE .Our people.
And our consumers. In fact, one of the
reasons we’re so successful is because
we’re a reflection of our consumers.
Like them, we’re dreamers, rebels,
adventurers, teachers and inventors.
From our stockrooms to our boardroom,
we live our brands.