North Face 2004 Annual Report Download - page 27
Download and view the complete annual report
Please find page 27 of the 2004 North Face annual report below. You can navigate through the pages in the report by either clicking on the pages listed below, or by using the keyword search tool below to find specific information within the annual report.-
 1
1 -
2
-
3
-
4
-
5
-
6
-
7
-
8
-
9
-
10
-
11
-
12
-
13
-
14
-
15
-
16
-
 17
17 -
 18
18 -
 19
19 -
 20
20 -
 21
21 -
 22
22 -
 23
23 -
 24
24 -
 25
25 -
 26
26 -
 27
27 -
 28
28 -
 29
29 -
 30
30 -
 31
31 -
 32
32 -
 33
33 -
 34
34 -
 35
35 -
 36
36 -
 37
37 -
38
-
39
-
40
-
41
-
42
-
43
-
44
-
45
-
46
-
47
-
48
-
49
-
50
-
51
-
52
-
53
-
54
-
55
-
56
-
57
-
58
 |
 |

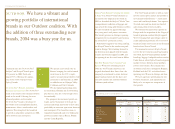
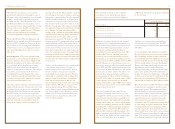
49vf corporation 2004 Annual Report
16%, driven by growth in our core (i.e., ongoing)
businesses, the full year effect of our 2003 acquisi-
tion of Nautica Enterprises, Inc. (“Nautica”) and
four acquisitions completed in 2004. We currently
expect sales growth of 6 – 8% in 2005, excluding
any additional acquisitions. On a longer-term
basis, achieving our growth target will require a
combination of core growth and acquisitions.
In our search for acquisitions, we focus on branded
apparel businesses that satisfy our strategic and
financial goals. Refer to the section titled “Strategic
Objectives” for further details.
•Operating income of 14% of sales – In recent years,
we have made progress toward this goal, as
demonstrated by attaining an operating margin
of 12.8% in 2004.
Many of our businesses currently exceed the 14%
benchmark, and nearly all of our businesses have
double digit margins. We continually evaluate our
existing businesses, which in 2004 resulted in the
decision to exit our Healthtex® and licensed Nike®
childrenswear business (“VF Playwear”) as it no
longer met our strategic and financial objectives.
We believe that our recently acquired companies
can achieve the 14% target.
The improvement in operating margins in recent
years was related, in part, to specific actions taken
to reduce our cost structure. These actions have
focused on lowering our product cost by moving
our production to lower cost locations around the
world. We will continue to pursue cost reduction
opportunities in product cost, distribution and
administrative areas.
•Return on invested capital of 17% – We believe that
a high return on capital is closely correlated with
enhancing shareholder value. We calculate return
on invested capital as follows:
Income before net interest expense,
after income taxes
Average short and long-term debt,
plus common stockholders’ equity
VF earned a 15.8% return on capital in 2004.
We expect acquisition targets will achieve returns
in line with our 17% return on capital goal.
•Debt to capital of less than 40% – To maintain a
conservative financial position, we have established
a goal of keeping our total debt to less than 40% of
our total capitalization, with capitalization defined
as our combined short and long-term debt plus
common stockholders’ equity. We would, however,
be willing to exceed this target ratio, on a short-term
basis, to support an appropriate investment opportu-
nity. Despite significant acquisition spending in the
last two years, this ratio was reduced to 28.5% at the
end of 2004. And at year-end, we reported $485.5
million in cash and equivalents, demonstrating VF’s
ability to generate strong cash flow from operations.
•Dividend payout ratio of 30% – Our target is to
return 30% of our earnings to our stockholders
through a consistent dividend policy. We have
maintained this payout ratio on a long-term basis.
VF has increased dividends paid per share each
year for the past 32 years. Our payout rate was
24.9% for 2004. In the fourth quarter of 2004,
we increased the quarterly dividend to an indicated
annual payout of $1.08 per share for 2005.
Strategic Objectives
In early 2004, we developed a growth plan that we
believe will enable VF to achieve its long-term sales
and earnings targets. Our growth strategy consists
of five drivers:
1.Build new growing lifestyle brands. Focus on
building more growing, global lifestyle brands
with an emphasis on younger consumers and
on female consumers.
2. Expand our share with winning customers. Adapt
our organizational structure to a more customer-
specific focus to more successfully expand market
share and leverage new business opportunities
with these successful retailers.
3. Stretch our brands and customers to new geographies.
Grow our international presence, particularly
in rapidly expanding economies such as those
in the Far East.
4. Fuel the growth. Leverage our supply chain and
information technology capabilities across VF
to drive costs and inventory levels lower, increase
productivity and integrate acquisitions efficiently.
5.Build new growth enablers. Support our growth
plans by identifying and developing high potential
employees and by recruiting qualified leaders with
new skill sets.
Highlights of 2004
There were several notable actions and results in 2004:
•Sales, net income, earnings per share and cash flow
were each at record levels.
•VF completed four acquisitions – Vans® brand
performance and casual footwear and apparel for
skateboarders and other action sports participants
and enthusiasts (“Vans”); Kipling® brand backpacks,
bags and accessories (“Kipling”); Napapijri® brand
premium outdoor-based sportswear (“Napapijri”);
and a 51% interest in an intimate apparel marketing
company in Mexico. These are collectively referred
to as the “2004 Acquisitions.”
•Net sales increased 16% to $6,054.5 million.
In addition to sales of the 2004 Acquisitions,
contributing to this increase were a full year of sales
of Nautica (compared with four months in the prior
year following its acquisition) and organic sales
growth in core businesses.
•Net income increased 19% to $474.7 million, and
earnings per share increased 17% to $4.21. (All per
share amounts are presented on a diluted basis.)
These increases resulted from improved operating
performance in most core businesses, plus profit
contributions from our 2004 and 2003 acquisitions
mentioned above.
•We invested $40 million in specific growth and cost
reduction initiatives that will assist VF in meeting its
long-term sales and earnings targets. This spending
was not originally planned for 2004.
•We sold our VF Playwear business, which had been
underperforming in recent years.
•Integration of our recent acquisitions is proceeding
on or ahead of schedule.
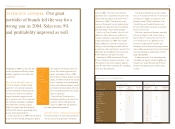
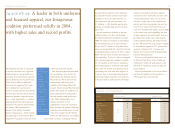
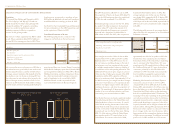
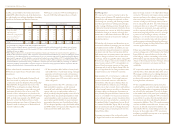
6,055
5,207 5,084
2004 2003 2002
39.8 37.4 36.0
2004 2003 2002
28.5
33.7
28.6
2004 2003 2002
sales
(Dollars in millions)
gross margin
(Percent to sales)
debt to capital ratio
(Percent)