North Face 2004 Annual Report Download - page 31
Download and view the complete annual report
Please find page 31 of the 2004 North Face annual report below. You can navigate through the pages in the report by either clicking on the pages listed below, or by using the keyword search tool below to find specific information within the annual report.-
 1
1 -
2
-
3
-
4
-
5
-
6
-
7
-
8
-
9
-
10
-
11
-
12
-
13
-
14
-
15
-
16
-
17
-
18
-
19
-
20
-
 21
21 -
 22
22 -
 23
23 -
 24
24 -
 25
25 -
 26
26 -
 27
27 -
 28
28 -
 29
29 -
 30
30 -
 31
31 -
 32
32 -
 33
33 -
 34
34 -
 35
35 -
 36
36 -
 37
37 -
 38
38 -
 39
39 -
 40
40 -
 41
41 -
42
-
43
-
44
-
45
-
46
-
47
-
48
-
49
-
50
-
51
-
52
-
53
-
54
-
55
-
56
-
57
-
58
 |
 |

57vf corporation 2004 Annual Report
Sportswear: The Sportswear coalition consists of our
Nautica® fashion sportswear, John Varvatos® luxury
apparel and accessories and Earl Jean® fashion jeans
brands, all acquired as part of the Nautica acquisition
in August 2003. Both Coalition Sales and Coalition
Profit include a full year of operating results for 2004,
compared with only four months in 2003. On a
comparable full year basis and as anticipated at the
time of the acquisition, unit sales for the Nautica®
brand declined slightly due to fewer department store
doors. Unit sales also declined at Earl Jean but
advanced at John Varvatos. Also on a comparable full
year basis, Coalition Profit for the Nautica® brand
increased due to improved retail performance resulting
in fewer markdowns and returns, cost reductions,
the exit of an unprofitable product line and other
operating efficiencies.
The operating plan for the Nautica business at
the acquisition date was to (1) restore and rebuild
the brand’s image, (2) stabilize its men’s wholesale
sportswear business by designing product that was
consistent with the brand’s image, (3) grow the other
core businesses, including men’s jeans, retail and
licensing, and (4) exit underperforming businesses.
Several management team changes were made to
drive the needed changes in the business. The 2004
product lines were returned to the more classic
Nautica® brand styling, and we made substantial
progress toward achieving each of the four operating
objectives set forth above. We believe that Nautica
is positioned for growth and increased profitability
in 2005, and we expect another year of significant
growth in John Varvatos.
Other: The Other business segment consists primarily
of VF Playwear. Trademarks and certain operating
assets of this business unit were sold in May 2004.
Inventories and other retained assets were liquidated
during the remainder of the year. The segment loss
in 2004 included net charges of $9.5 million related
to the disposal of this business. See Note C to the
consolidated financial statements for a summary of
VF Playwear’s sales and losses for the three years.
This segment also includes the VF Outlet business
unit, which consists of company-operated retail
outlet stores in the United States that sell a broad
selection of products, primarily excess quantities
of first quality VF products. Sales and profit of
non-VF products (primarily hosiery, underwear
and accessories to provide a broader selection
of merchandise to attract consumer traffic) are
reported in this business segment. Sales and profit
of VF products are reported as part of the operating
results of the respective coalitions.
Reconciliation of Coalition Profit to Consolidated
Income before Income Taxes: There are two types of
costs necessary to reconcile total Coalition Profit, as
discussed in the preceding paragraphs, to Consolidated
Income from Continuing Operations before Income
Taxes. These costs, discussed below, are Interest
and Corporate and Other Expenses. See Note R
to the Consolidated Financial Statements.
Interest Expense, Net, was discussed in the previous
“Consolidated Statements of Income” section.
Interest is excluded from Coalition Profit because
substantially all of our financing costs are managed
at the corporate office and are not under the control
of coalition management.
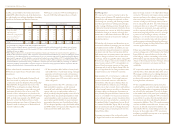
Corporate and Other Expenses consists of corporate
and similar costs that are not apportioned to the
operating coalitions. These expenses are summarized
as follows and discussed in the paragraphs below:
•Information Systems – Included are costs of our
U.S.-based management information systems and
of our centralized shared services center. Operating
costs of information systems and shared services
are charged to the coalitions based on utilization
of those services, such as minutes of computer
processing time, number of transactions or number
of users. However, costs to develop new computer
applications that will be used across VF are not
allocated to the coalitions. The biggest factor in
the information systems cost increase in 2004 was
$8.3 million of consulting, severance and asset
write-downs related to outsourcing certain of our
information technology needs to a major third party
service provider.
•Corporate Headquarters’ Costs – Headquarters’
costs include compensation and benefits of corpo-
rate management and staff, legal and professional
fees, and administrative and general expenses,
which are not apportioned to the coalitions.
Costs increased in 2004 primarily due to a
$15.0 million increase in incentive compensation
related to VF’s strong 2004 financial performance
relative to its targets. Also included in 2004 was
$5.8 million of consulting and research expenses
related to VF’s growth and cost saving initiatives.
•Trademark Maintenance and Enforcement – Legal
and other costs of registering, maintaining and
enforcing VF’s portfolio of trademarks, plus
costs of licensing administration, are controlled
by a centralized trademark and licensing staff
and are not allocated to the coalitions.
•Other – This category includes (1) adjustments to
convert the earnings of certain business units using
the FIFO inventory valuation method for internal
reporting to the LIFO method for consolidated
financial reporting, (2) other consolidating adjust-
ments and (3) miscellaneous costs that result from
corporate programs or corporate-managed deci-
sions that are not allocated to the business units
for internal management reporting. In 2002, this
category included a special $8.0 million incentive
compensation payment covering most employees
and an increase of $3.7 million in worker’s
compensation expense based on consultation with
our independent adviser. These charges were
retained in corporate for internal management
reporting and not apportioned to the coalitions
due to the nature of these items and the inability
of our coalition management to influence them.
analysis of financial condition
Balance Sheets
Accounts Receivable increased in 2004 primarily
due to the 2004 Acquisitions. The number of days’
sales outstanding increased slightly in 2004 due to
longer terms offered to customers at certain of the
2004 Acquisitions.
Inventories increased in 2004 due to the 2004
Acquisitions. Inventory levels at core businesses
declined 3% from the end of 2003. Inventories have
been declining in recent years through more efficient
sales forecasting and production planning techniques.
In addition, sales near the end of 2004 were higher
than forecasted, resulting in inventory levels
below expectations.
Property, Plant and Equipment declined in 2004
because depreciation expense during the year
exceeded the sum of capital spending and assets
acquired as part of the 2004 Acquisitions. Intangible
Assets and Goodwill each increased in 2004 due
to the 2004 Acquisitions. See Notes B, F, G and H
to the Consolidated Financial Statements.
Deferred Income Taxes, recorded as noncurrent assets,
declined in 2004 due to the inclusion of $85.6 million
of noncurrent deferred income tax credits arising
from the 2004 Acquisitions. These deferred tax
credits related primarily to Intangible Assets of the
acquired companies.
Accounts Payable increased in 2004 due to the 2004
Acquisitions and growth in our businesses. Accrued
Liabilities increased due to the 2004 Acquisitions
and an increase in accrued compensation related to
increased incentive compensation payable based on
VF’s strong 2004 performance relative to its targets.
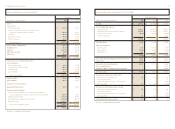
In millions 2004 2003 2002
Information systems $137.1 $ 125.1 $ 126.4
Less costs apportioned to segments (108.4) (102.1) (101.1)
28.7 23.0 25.3
Corporate headquarters’ costs 69.6 46.7 47.5
Trademark maintenance and enforcement 12.9 10.3 11.3
Other (2.0) 1.5 19.4
Corporate and Other Expenses $109.2 $ 81.5 $ 103.5