North Face 2004 Annual Report Download - page 40
Download and view the complete annual report
Please find page 40 of the 2004 North Face annual report below. You can navigate through the pages in the report by either clicking on the pages listed below, or by using the keyword search tool below to find specific information within the annual report.-
 1
1 -
2
-
3
-
4
-
5
-
6
-
7
-
8
-
9
-
10
-
11
-
12
-
13
-
14
-
15
-
16
-
17
-
18
-
19
-
20
-
21
-
22
-
23
-
24
-
25
-
26
-
27
-
28
-
29
-
 30
30 -
 31
31 -
 32
32 -
 33
33 -
 34
34 -
 35
35 -
 36
36 -
 37
37 -
 38
38 -
 39
39 -
 40
40 -
 41
41 -
 42
42 -
 43
43 -
 44
44 -
 45
45 -
 46
46 -
 47
47 -
 48
48 -
 49
49 -
 50
50 -
51
-
52
-
53
-
54
-
55
-
56
-
57
-
58
 |
 |

vf corporation 2004 Annual Report
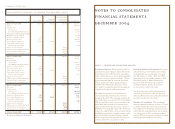
notes to consolidated
financial statements
december 2004
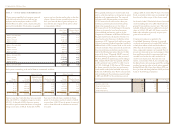
Description of Business: VF Corporation (“VF”) is a
multinational consumer apparel company based in the
United States (“U.S.”). VF, through its subsidiaries,
designs and manufactures or sources from independent
contractors a variety of apparel for all ages. VF has
significant market shares in jeanswear, sportswear,
intimate apparel and outdoor apparel marketed
primarily under VF-owned brand names. VF is
also a leader in occupational apparel and in daypacks,
backpacks and technical outdoor equipment.
VF markets these products to a broad customer
base of specialty, department and discount stores
throughout the world. VF’s ten largest customers, all
U.S.-based retailers, accounted for 38% of consolidated
2004 sales and 29% of total accounts receivable at the
end of 2004. Sales are made on an unsecured basis
under customary terms that may vary by channel of
distribution or by geographic region. VF continuously
monitors the creditworthiness of its customers and has
established internal policies regarding customer credit
limits. The breadth of product offerings, combined
with the large number and geographic diversity of its
customers, limits VF’s concentration of risks.
Fiscal Year and Basis of Presentation: VF operates
and reports using a 52/53 week fiscal year ending
on the Saturday closest to December 31 of each
year. All references to “2004”, “2003” and “2002”
relate to the fiscal years ended on January 1, 2005
(52 weeks), January 3, 2004 (52 weeks) and
January 4, 2003 (53 weeks), respectively. For
presentation purposes herein, all fiscal years
are presented as ended in December.
The financial position, results of operations and
cash flows of two businesses that were disposed
of during 2002 have been presented as discontinued
operations for all periods. See Note C.
Principles of Consolidation: The consolidated
financial statements include the accounts of VF and
its wholly-owned and majority-owned subsidiaries,
after elimination of intercompany transactions and
profits. Minority ownership interests are not signifi-
cant. Investments in 50%-owned joint ventures,
in which VF does not exercise control, are accounted
for using the equity method of accounting.
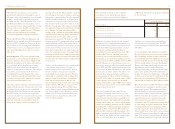
note a – significant accounting policies
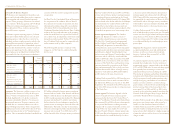
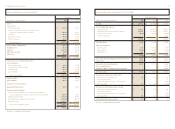
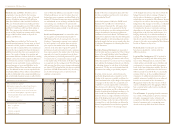
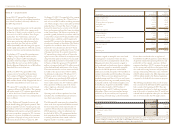
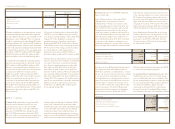
consolidated statements of common stockholders’equity
Accumulated Other
Additional Comprehensive
In thousands Common Stock Paid-in Capital Income (Loss) Retained Earnings
Balance, December 2001 $ 109,998 $ 884,638 $ (103,040) $ 1,221,200
Net loss – – – (154,543)
Cash dividends:
Common Stock – – – (106,018)
Series B Redeemable Preferred Stock – – – (2,755)
Tax benefit from Preferred Stock dividends – – – 12
Redemption of Preferred Stock – – – (5,780)
Conversion of Preferred Stock 182 – – 3,332
Purchase of treasury shares (3,000) – – (121,623)
Stock compensation plans, net 1,345 45,494 – (381)
Common Stock held in trust for
deferred compensation plans – – – (112)
Foreign currency translation – – 25,441 –
Minimum pension liability adjustment – – (126,841) –
Derivative financial instruments – – (9,461) –
Unrealized losses on marketable securities – – (240) –
Balance, December 2002 108,525 930,132 (214,141) 833,332
Net income – – – 397,933
Cash dividends:
Common Stock – – – (109,020)
Series B Redeemable Preferred Stock – – – (2,238)
Conversion of Preferred Stock 358 – – 6,556
Purchase of treasury shares (1,680) – – (59,720)
Stock compensation plans, net 943 34,858 – (333)
Common Stock held in trust for
deferred compensation plans 24 – – 1,092
Foreign currency translation – – 48,843 –
Minimum pension liability adjustment – – (32,356) –
Derivative financial instruments – – 819 –
Unrealized gains on marketable securities – – 7,380 –
Balance, December 2003 108,170 964,990 (189,455) 1,067,602
Net income – – – 474,702
Cash dividends:
Common Stock – – – (115,900)
Series B Redeemable Preferred Stock – – – (1,831)
Conversion of Preferred Stock 205 – – 3,729
Stock compensation plans, net 3,026 122,651 – (273)
Common Stock held in trust for
deferred compensation plans (13) – – (746)
Foreign currency translation – – 30,069 –
Minimum pension liability adjustment – – 41,712 –
Derivative financial instruments – – (691) –
Unrealized gains on marketable securities – – 5,294 –
Balance, December 2004 $111,388 $ 1,087,641 $ (113,071) $ 1,427,283
See notes to consolidated financial statements.