North Face 2004 Annual Report Download - page 47
Download and view the complete annual report
Please find page 47 of the 2004 North Face annual report below. You can navigate through the pages in the report by either clicking on the pages listed below, or by using the keyword search tool below to find specific information within the annual report.-
 1
1 -
2
-
3
-
4
-
5
-
6
-
7
-
8
-
9
-
10
-
11
-
12
-
13
-
14
-
15
-
16
-
17
-
18
-
19
-
20
-
21
-
22
-
23
-
24
-
25
-
26
-
27
-
28
-
29
-
30
-
31
-
32
-
33
-
34
-
35
-
36
-
 37
37 -
 38
38 -
 39
39 -
 40
40 -
 41
41 -
 42
42 -
 43
43 -
 44
44 -
 45
45 -
 46
46 -
 47
47 -
 48
48 -
 49
49 -
 50
50 -
 51
51 -
 52
52 -
 53
53 -
 54
54 -
 55
55 -
 56
56 -
 57
57 -
58
 |
 |

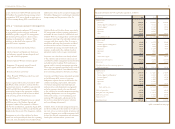
89vf corporation 2004 Annual Report
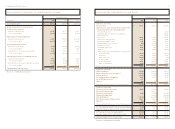
Dollars in thousands 2004 2003
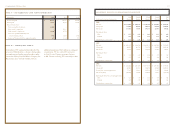
Fair value of plan assets, beginning of year $ 647,723 $ 519,013
Actual return on plan assets 68,583 86,290
VF contributions 57,947 77,481
Benefits paid (40,447) (35,061)
Fair value of plan assets, end of year 733,806 647,723
Projected benefit obligations, beginning of year 957,437 797,173
Service cost 22,470 18,475
Interest cost 59,272 53,883
Plan amendments 25,783 501
Partial plan curtailment (3,188) –
Actuarial (gain) loss (14,897) 122,466
Benefits paid (40,447) (35,061)
Projected benefit obligations, end of year 1,006,430 957,437
Funded status, end of year (272,624) (309,714)
Unrecognized net actuarial loss267,727 321,375
Unrecognized prior service cost 32,642 17,919
Pension asset, net $27,745 $ 29,580
Amounts included in Consolidated Balance Sheets:
Noncurrent assets $46,960 $ 17,919
Current liabilities (55,000) (55,000)
Noncurrent liabilities (158,521) (193,614)
Accumulated other comprehensive income (loss) 194,306 260,275
$27,745 $ 29,580
Assumptions used to determine benefit obligations:
Discount rate 6.10%6.00%
Rate of compensation increase 3.75%3.75%
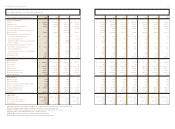
Dollars in thousands 2004 2003 2002
Service cost – benefits earned during the year $ 22,470 $ 18,475 $ 18,240
Interest cost on projected benefit obligations 59,272 53,883 51,734
Expected return on plan assets (59,728) (48,225) (50,433)
Curtailment charge 7,100 – 2,388
Amortization of:
Prior service cost 3,960 3,138 4,243
Actuarial loss 24,697 28,425 1,370
Total pension expense 57,771 55,696 27,542
Amount allocable to discontinued operations –– 1,317
Pension expense – continuing operations $ 57,771 $ 55,696 $ 26,225
Assumptions used to determine pension expense:
Discount rate 6.00%6.75%7.50%
Expected long-term return on plan assets 8.50%8.75%8.75%
Rate of compensation increase 3.75%4.00%4.00%
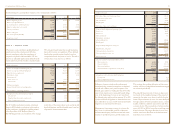
The $7.1 million partial pension plan curtailment
charge in 2004 related to reductions in the number
of plan participants, including $2.9 million related
to the disposition of VF Playwear (Note C).
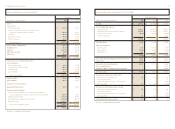
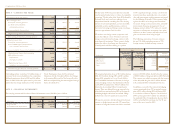
The following provides a reconciliation of the changes
in fair value of the pension plans’ assets and projected
benefit obligations, and their funded status, based on
a September 30 measurement date:
note n – benefit plans
VF sponsors a noncontributory qualified defined
benefit pension plan covering most full-time
domestic employees other than employees of
companies acquired in 2004 and 2003. VF also
sponsors an unfunded supplemental defined benefit
pension plan that provides benefits computed under
VF’s principal benefit plan that exceed limitations
imposed by income tax regulations. These defined
benefit plans provide pension benefits based on
compensation levels and years of service. The effect
of these plans on income was as follows:
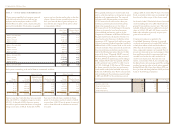
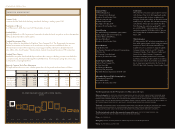
In thousands 2004 2003 2002
Balance, beginning of year $ 28,852 $ 25,782 $ 21,698
Balances of acquired businesses 347 ––
Accrual for products sold during the year 10,788 10,597 8,548
Repair or replacement costs incurred (6,840) (8,552) (5,293)
Currency translation 1,022 1,025 829
Balance, end of year 34,169 28,852 $ 25,782
Less current portion (Note K) 7,193 8,426
Long-term accrual $ 26,976 $ 20,426
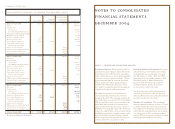
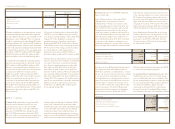
Differences between actual results and amounts
determined using actuarial assumptions are deferred
and will affect future years’ pension expense. Net
deferred gains and losses totaling less than 10% of the
lower of investment assets or projected benefit obliga-
tions at the beginning of a year are not amortized.
Net deferred gains and losses that represent 10 to 20%
of projected benefit obligations are amortized over ten
years, while those in excess of 20% of projected benefit
obligations are amortized over five years.
Management’s investment strategy is to invest the
plan’s assets in a diversified portfolio of domestic
and international equity, fixed income and real estate
securities to provide long-term growth in plan assets.
This strategy, the resulting allocation of plan assets
and the selection of independent investment managers
are reviewed periodically.
The expected long-term rate of return on plan assets
was based on the weighted average of the expected
returns for the major asset classes in which the plan
invests. Expected returns by asset class were developed
through analysis of historical market returns, current
market conditions, inflation expectations and other
economic factors. The assumed rate of return on plan
assets of 8.50% in 2004 is lower than actual long-term
historical returns. The target allocation by asset class,
and the actual asset allocations at the latest measure-
ment dates, were as follows:
Activity relating to accrued product warranty costs is summarized as follows: