NVIDIA 2007 Annual Report Download - page 74
Download and view the complete annual report
Please find page 74 of the 2007 NVIDIA annual report below. You can navigate through the pages in the report by either clicking on the pages listed below, or by using the keyword search tool below to find specific information within the annual report.-
 1
1 -
2
-
3
-
4
-
5
-
6
-
7
-
8
-
9
-
10
-
11
-
12
-
13
-
14
-
15
-
16
-
17
-
18
-
19
-
20
-
21
-
22
-
23
-
24
-
25
-
26
-
27
-
28
-
29
-
30
-
31
-
32
-
33
-
34
-
35
-
36
-
37
-
38
-
39
-
40
-
41
-
42
-
43
-
44
-
45
-
46
-
47
-
48
-
49
-
50
-
51
-
52
-
53
-
54
-
55
-
56
-
57
-
58
-
59
-
60
-
61
-
62
-
63
-
 64
64 -
 65
65 -
 66
66 -
 67
67 -
 68
68 -
 69
69 -
 70
70 -
 71
71 -
 72
72 -
 73
73 -
 74
74 -
 75
75 -
 76
76 -
 77
77 -
 78
78 -
 79
79 -
 80
80 -
 81
81 -
 82
82 -
 83
83 -
 84
84 -
85
-
86
-
87
-
88
-
89
-
90
-
91
-
92
-
93
-
94
-
95
-
96
-
97
-
98
-
99
-
100
-
101
-
102
-
103
-
104
-
105
-
106
-
107
-
108
-
109
-
110
-
111
-
112
-
113
-
114
 |
 |

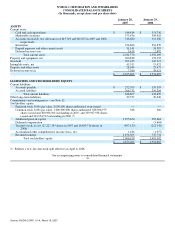
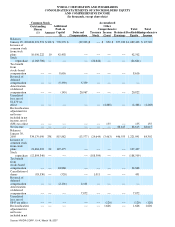
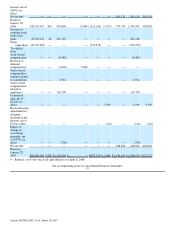
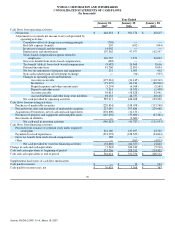
NVIDIA CORPORATION AND SUBSIDIARIES
NOTES TO CONSOLIDATED FINANCIAL STATEMENTS
(Continued)
Litigation, Investigation and Settlement Costs
From time to time, we are involved in legal actions and/or investigations by regulatory bodies. We are aggressively defending
our current litigation matters. However, there are many uncertainties associated with any litigation or investigation, and we cannot be
certain that these actions or other third−party claims against us will be resolved without costly litigation, fines and/or substantial
settlement payments. If that occurs, our business, financial condition and results of operations could be materially and adversely
affected. If information becomes available that causes us to determine that a loss in any of our pending litigation, investigations or
settlements is probable, and we can reasonably estimate the loss associated with such events, we will record the loss in accordance
with accounting principles generally accepted in the United States. However, the actual liability in any such litigation or investigations
may be materially different from our estimates, which could require us to record additional costs.
Comprehensive Income
Comprehensive income consists of net income and other comprehensive income or loss. Other comprehensive income or loss
components include unrealized gains or losses on available−for−sale securities, net of tax.
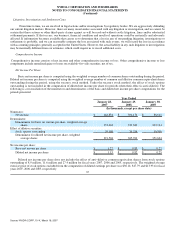
Net Income Per Share
Basic net income per share is computed using the weighted average number of common shares outstanding during the period.
Diluted net income per share is computed using the weighted average number of common and dilutive common equivalent shares
outstanding during the period, using the treasury stock method. Under the treasury stock method, the effect of stock options
outstanding is not included in the computation of diluted net income per share for periods when their effect is anti−dilutive. The
following is a reconciliation of the numerators and denominators of the basic and diluted net income per share computations for the
periods presented:
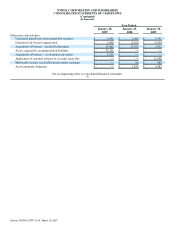
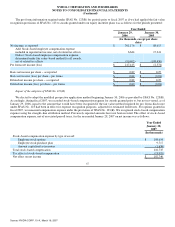
Year Ended
January 28,
2007 January 29,
2006 January 30,
2005
(In thousands, except per share data)
Numerator:
Net income $ 448,834 $ 301,176 $ 88,615
Denominator:
Denominator for basic net income per share, weighted average
shares 352,404 339,380 332,124
Effect of dilutive securities:
Stock options outstanding 39,100 26,324 19,500
Denominator for diluted net income per share, weighted
average shares 391,504 365,704 351,624
Net income per share:
Basic net income per share $ 1.27 $ 0.89 $ 0.27
Diluted net income per share $ 1.15 $ 0.82 $ 0.25
Diluted net income per share does not include the effect of anti−dilutive common equivalent shares from stock options
outstanding of 8.9 million, 11.6 million and 27.4 million for fiscal years 2007, 2006 and 2005, respectively. The weighted average
exercise price of stock options excluded from the computation of diluted earnings per share was $30.14, $17.79 and $13.93 for fiscal
years 2007, 2006 and 2005, respectively. 65
Source: NVIDIA CORP, 10−K, March 16, 2007