NVIDIA 2007 Annual Report Download - page 67
Download and view the complete annual report
Please find page 67 of the 2007 NVIDIA annual report below. You can navigate through the pages in the report by either clicking on the pages listed below, or by using the keyword search tool below to find specific information within the annual report.-
 1
1 -
2
-
3
-
4
-
5
-
6
-
7
-
8
-
9
-
10
-
11
-
12
-
13
-
14
-
15
-
16
-
17
-
18
-
19
-
20
-
21
-
22
-
23
-
24
-
25
-
26
-
27
-
28
-
29
-
30
-
31
-
32
-
33
-
34
-
35
-
36
-
37
-
38
-
39
-
40
-
41
-
42
-
43
-
44
-
45
-
46
-
47
-
48
-
49
-
50
-
51
-
52
-
53
-
54
-
55
-
56
-
 57
57 -
 58
58 -
 59
59 -
 60
60 -
 61
61 -
 62
62 -
 63
63 -
 64
64 -
 65
65 -
 66
66 -
 67
67 -
 68
68 -
 69
69 -
 70
70 -
 71
71 -
 72
72 -
 73
73 -
 74
74 -
 75
75 -
 76
76 -
 77
77 -
78
-
79
-
80
-
81
-
82
-
83
-
84
-
85
-
86
-
87
-
88
-
89
-
90
-
91
-
92
-
93
-
94
-
95
-
96
-
97
-
98
-
99
-
100
-
101
-
102
-
103
-
104
-
105
-
106
-
107
-
108
-
109
-
110
-
111
-
112
-
113
-
114
 |
 |

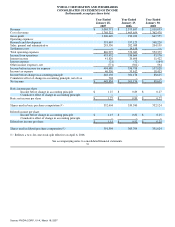
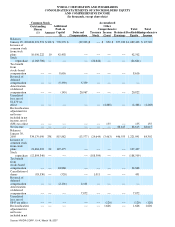
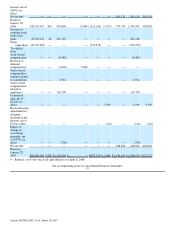
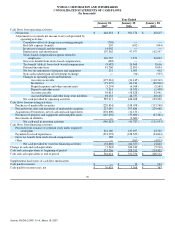
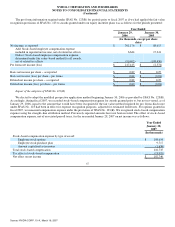
NVIDIA CORPORATION AND SUBSIDIARIES
CONSOLIDATED STATEMENTS OF CASH FLOWS
(In thousands)
Year Ended
January 28,
2007 January 29,
2006 January 30,
2005
Cash flows from operating activities:
Net income $ 448,834 $ 301,176 $ 88,615
Adjustments to reconcile net income to net cash provided by
operating activities:
Cumulative effect of change in accounting principle (704) −− −−
Bad debt expense (benefit) 205 (492) (844)
In−process research and development 14,002 −− −−
Depreciation and amortization 107,562 97,977 102,597
Stock−based compensation expense related to
employees 116,735 7,872 20,822
Gross tax benefit from stock−based compensation (188) −− −−
Tax benefit (deficit) from stock−based compensation (8,482) 24,868 8,616
Deferred income taxes 41,766 (2,691) 8,694
Net loss on retirements of property and equipment 251 1,005 412
Non−cash realized gain on investment exchange −− (96) (533)
Changes in operating assets and liabilities:
Accounts receivable (175,261) (21,415) (110,312)
Inventories (91,395) 60,916 (80,906)
Prepaid expenses and other current assets (5,294) (4,568) (5,569)
Deposits and other assets 7,314 (8,073) (1,458)
Accounts payable 38,613 (58,828) 52,941
Accrued liabilities and other long−term liabilities 93,153 48,757 49,125
Net cash provided by operating activities 587,111 446,408 132,200
Cash flows from investing activities:
Purchases of marketable securities (220,834) (338,058) (313,760)
Proceeds from sales and maturities of marketable securities 227,067 397,686 229,068
Acquisition of businesses, net of cash and cash equivalents (401,800) (12,131) −−
Purchases of property and equipment and intangible assets (145,256) (79,600) (67,261)
Investments in affiliates −− (9,684) −
Net cash used in investing activities (540,823) (41,787) (151,953)
Cash flows from financing activities:
Proceeds from issuance of common stock under employee
stock plans 221,160 127,497 42,502
Payments for stock repurchases (274,978) (188,509) (24,644)
Gross tax benefit from stock−based compensation 188 −− −−
Other −− (365) (4,015)
Net cash provided by (used in) financing activities (53,630) (61,377) 13,843
Change in cash and cash equivalents (7,342) 343,244 (5,910)
Cash and cash equivalents at beginning of period 551,756 208,512 214,422
Cash and cash equivalents at end of period $ 544,414 $ 551,756 $ 208,512
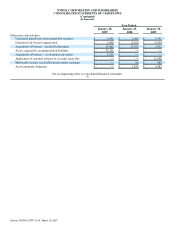
Supplemental disclosures of cash flow information:
Cash paid for interest $ −− $ 12 $ 163
Cash paid for income taxes, net $ 26,628 $ 3,368 $ 763
58
Source: NVIDIA CORP, 10−K, March 16, 2007