NVIDIA 2007 Annual Report Download - page 35
Download and view the complete annual report
Please find page 35 of the 2007 NVIDIA annual report below. You can navigate through the pages in the report by either clicking on the pages listed below, or by using the keyword search tool below to find specific information within the annual report.-
 1
1 -
2
-
3
-
4
-
5
-
6
-
7
-
8
-
9
-
10
-
11
-
12
-
13
-
14
-
15
-
16
-
17
-
18
-
19
-
20
-
21
-
22
-
23
-
24
-
 25
25 -
 26
26 -
 27
27 -
 28
28 -
 29
29 -
 30
30 -
 31
31 -
 32
32 -
 33
33 -
 34
34 -
 35
35 -
 36
36 -
 37
37 -
 38
38 -
 39
39 -
 40
40 -
 41
41 -
 42
42 -
 43
43 -
 44
44 -
 45
45 -
46
-
47
-
48
-
49
-
50
-
51
-
52
-
53
-
54
-
55
-
56
-
57
-
58
-
59
-
60
-
61
-
62
-
63
-
64
-
65
-
66
-
67
-
68
-
69
-
70
-
71
-
72
-
73
-
74
-
75
-
76
-
77
-
78
-
79
-
80
-
81
-
82
-
83
-
84
-
85
-
86
-
87
-
88
-
89
-
90
-
91
-
92
-
93
-
94
-
95
-
96
-
97
-
98
-
99
-
100
-
101
-
102
-
103
-
104
-
105
-
106
-
107
-
108
-
109
-
110
-
111
-
112
-
113
-
114
 |
 |

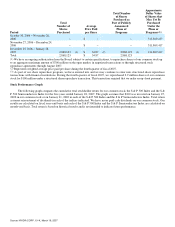
Period
Total
Number of
Shares
Purchased
Average
Price Paid
per Share
Total Number
of Shares
Purchased as
Part of Publicly
Announced
Plans of
Programs
Approximate
Dollar Value
of Shares that
May Yet Be
Purchased
Under the
Plans or
Programs (1)
October 30, 2006 − November 26,
2006 − $ − − 311,869,417
November 27, 2006 − December 24,
2006 − $ − − 311,869,417
December 25, 2006 − January 28,
2007 2,868,123 (3) $ 34.87 (2) 2,868,123 (3) 211,869,417
Total 2,868,123 $ 34.87 2,868,123
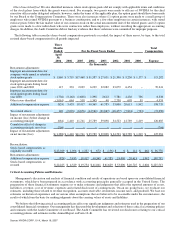
(1) We have an ongoing authorization from the Board, subject to certain specifications, to repurchase shares of our common stock up
to an aggregate maximum amount of $700 million on the open market, in negotiated transactions or through structured stock
repurchase agreements through August 2007.
(2) Represents weighted average price paid per share during the fourth quarter of fiscal 2007.
(3) As part of our share repurchase program, we have entered into and we may continue to enter into structured share repurchase
transactions with financial institutions. During the fourth quarter of fiscal 2007, we repurchased 2.9 million shares of our common
stock for $100 million under a structured share repurchase transaction. This transaction required that we make an up−front payment.
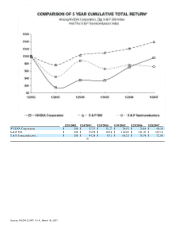
Stock Performance Graph
The following graph compares the cumulative total stockholder return for our common stock, the S & P 500 Index and the S &
P 500 Semiconductors Index for the five years ended January 28, 2007. The graph assumes that $100 was invested on January 25,
2002 in our common stock or on January 31, 2002 in each of the S & P 500 Index and the S & P Semiconductors Index. Total return
assumes reinvestment of dividends in each of the indices indicated. We have never paid cash dividends on our common stock. Our
results are calculated on fiscal year−end basis and each of the S & P 500 Index and the S & P Semiconductors Index are calculated on
month−end basis. Total return is based on historical results and is not intended to indicate future performance.
Source: NVIDIA CORP, 10−K, March 16, 2007